29
/
en
AIzaSyAYiBZKx7MnpbEhh9jyipgxe19OcubqV5w
April 1, 2024
241630
Slovak Republic
SVK
true
2
1
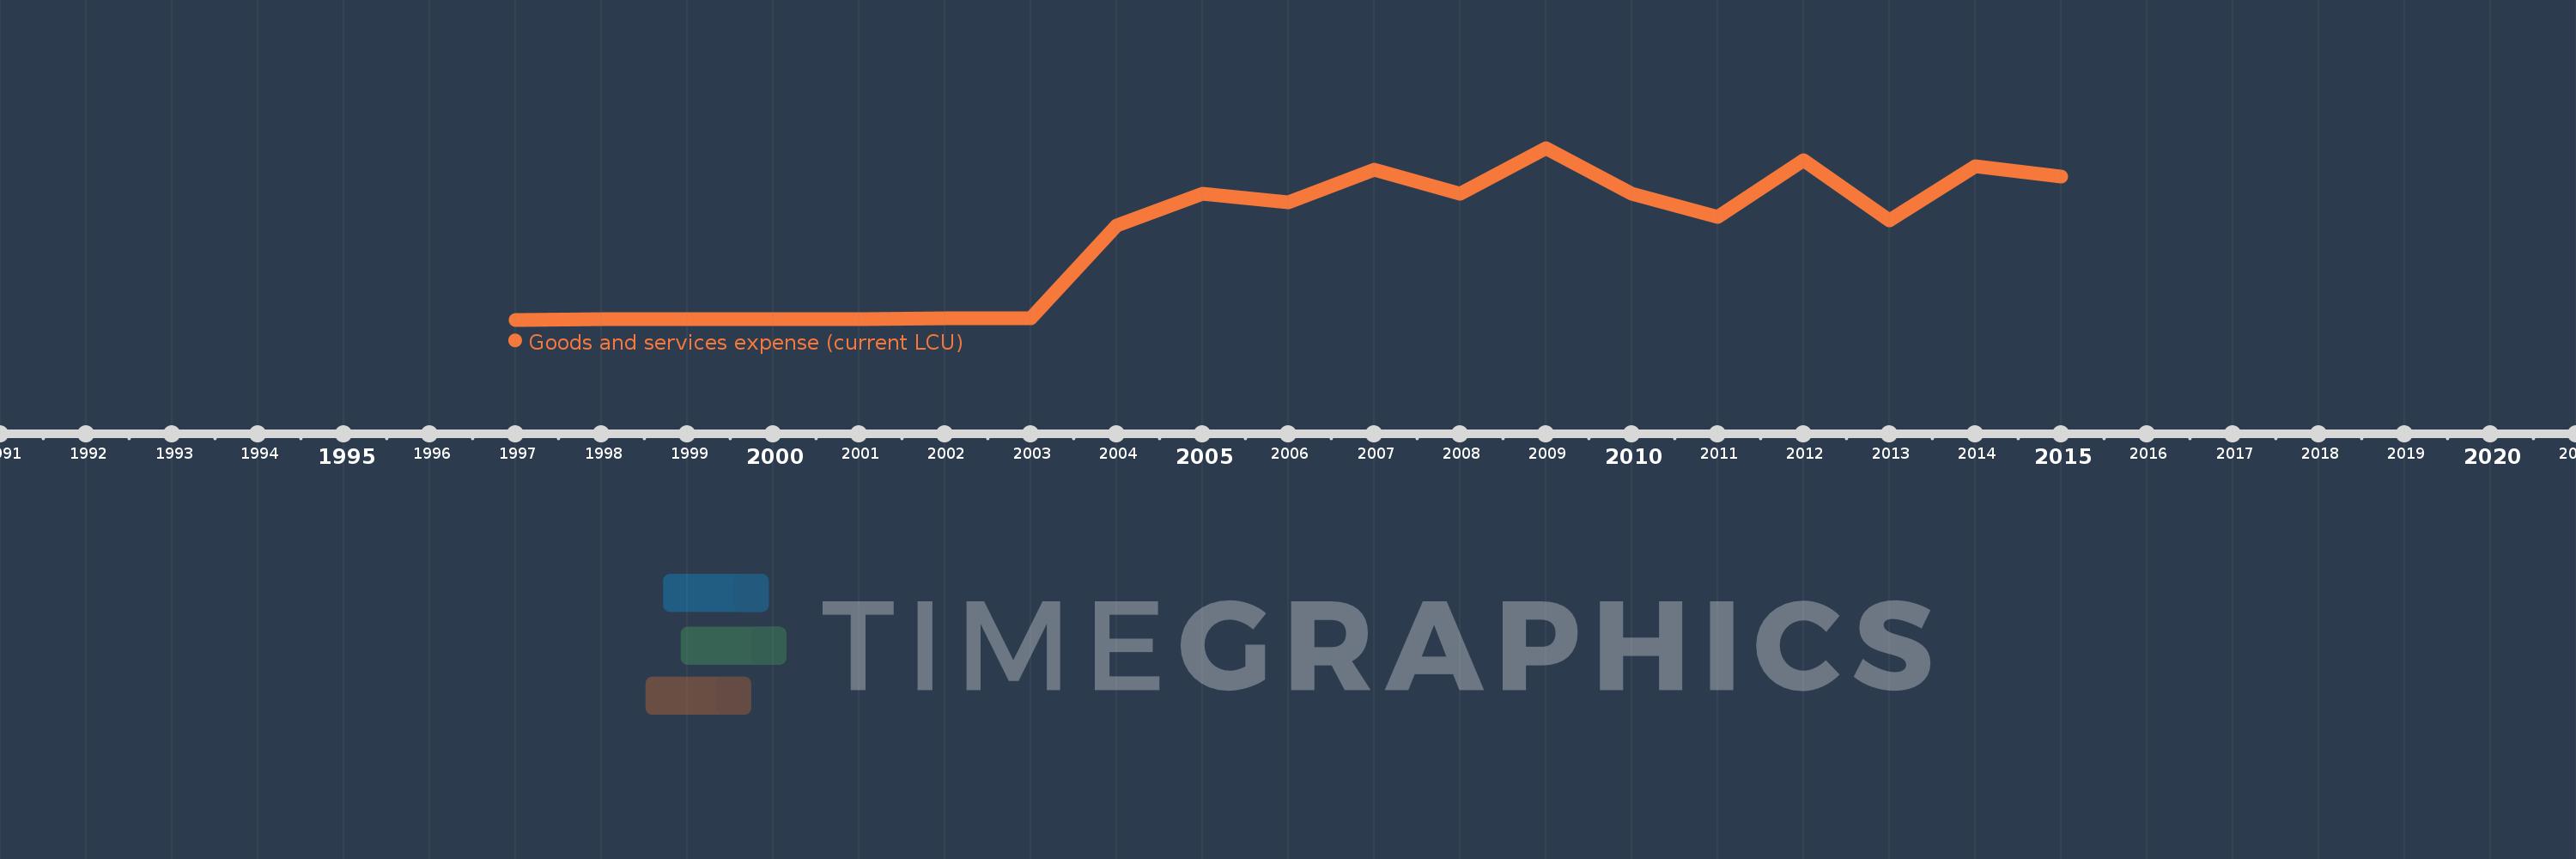
Goods and services expense (current LCU)
2015,2014,2013,2012,2011,2010,2009,2008,2007,2006,2005,2004,2003,2002,2001,2000,1999,1998,1997
This statistics in other country:
AfghanistanAlbaniaAlgeriaAngolaAntigua and BarbudaArmeniaAustraliaAustriaAzerbaijanBahamas, TheBahrainBangladeshBarbadosBelarusBelgiumBelizeBeninBhutanBoliviaBosnia and HerzegovinaBotswanaBrazilBulgariaBurkina FasoBurundiCabo VerdeCambodiaCanadaCentral African RepublicChileColombiaCongo, Dem. Rep.Congo, Rep.Costa RicaCote d'IvoireCroatiaCyprusCzech RepublicDenmarkDominicaDominican RepublicEgypt, Arab Rep.El SalvadorEquatorial GuineaEstoniaEthiopiaFijiFinlandFranceGambia, TheGeorgiaGermanyGhanaGreeceGrenadaGuatemalaHondurasHong Kong SAR, ChinaHungaryIcelandIndiaIndonesiaIran, Islamic Rep.IraqIrelandIsraelItalyJamaicaJapanJordanKazakhstanKenyaKiribatiKorea, Rep.KuwaitKyrgyz RepublicLao PDRLatviaLebanonLesothoLiberiaLithuaniaLuxembourgMacao SAR, ChinaMacedonia, FYRMadagascarMalawiMalaysiaMaldivesMaliMaltaMauritiusMexicoMicronesia, Fed. Sts.MoldovaMongoliaMoroccoMozambiqueNamibiaNepalNetherlandsNew ZealandNicaraguaNigeriaNorwayOmanPakistanPanamaPapua New GuineaParaguayPeruPhilippinesPolandPortugalQatarRomaniaRussian FederationRwandaSamoaSan MarinoSao Tome and PrincipeSenegalSerbiaSeychellesSierra LeoneSingaporeSlovak RepublicSloveniaSolomon IslandsSouth AfricaSpainSri LankaSt. Kitts and NevisSt. LuciaSurinameSwazilandSwedenSwitzerlandSyrian Arab RepublicTajikistanTanzaniaThailandTimor-LesteTogoTrinidad and TobagoTunisiaTurkeyUgandaUkraineUnited Arab EmiratesUnited KingdomUnited StatesUruguayVanuatuVenezuela, RBWest Bank and GazaYemen, Rep.ZambiaZimbabwe Timeline:
This timeline shows a graph from 1997 to 2015 of Slovak Republic. No data until 1996. Number of actual observations by date: 19.
Source name:
World Development Indicators
Source organization:
International Monetary Fund, Government Finance Statistics Yearbook and data files.
Categories, topics:
Public Sector
Last updated:
apr 23, 2017
Indicators value changes by year
Minimum:
24.658 mln
jan 1, 1997
Maximum:
1.832 bln
jan 1, 2009
At the date of observation
Value
Absolute change
Change from previous value
jan 1, 1997
24.658 mln
+24.658 mln
0.0%
jan 1, 1998
29.58 mln
+4.922 mln
19.96%
jan 1, 1999
28.29 mln
-1.29 mln
-4.36%
jan 1, 2000
29.566 mln
+1.276 mln
4.51%
jan 1, 2001
34.656 mln
+5.09 mln
17.22%
jan 1, 2002
39.338 mln
+4.682 mln
13.51%
jan 1, 2003
37.946 mln
-1.392 mln
-3.54%
jan 1, 2004
1.018 bln
+980.277 mln
2.58K%
jan 1, 2005
1.347 bln
+329.018 mln
32.31%
jan 1, 2006
1.264 bln
-82.752 mln
-6.14%
jan 1, 2007
1.601 bln
+336.387 mln
26.6%
jan 1, 2008
1.354 bln
-247.083 mln
-15.43%
jan 1, 2009
1.832 bln
+478.396 mln
35.34%
jan 1, 2010
1.35 bln
-481.795 mln
-26.3%
jan 1, 2011
1.108 bln
-242.008 mln
-17.92%
jan 1, 2012
1.706 bln
+597.172 mln
53.88%
jan 1, 2013
1.07 bln
-635.551 mln
-37.26%
jan 1, 2014
1.639 bln
+569.292 mln
53.2%
jan 1, 2015
1.533 bln
-106.385 mln
-6.49%
Ranking of countries by current statistics by years


Comments: