29
/
en
AIzaSyAYiBZKx7MnpbEhh9jyipgxe19OcubqV5w
April 1, 2024
94897
Burkina Faso
BFA
true
2
1
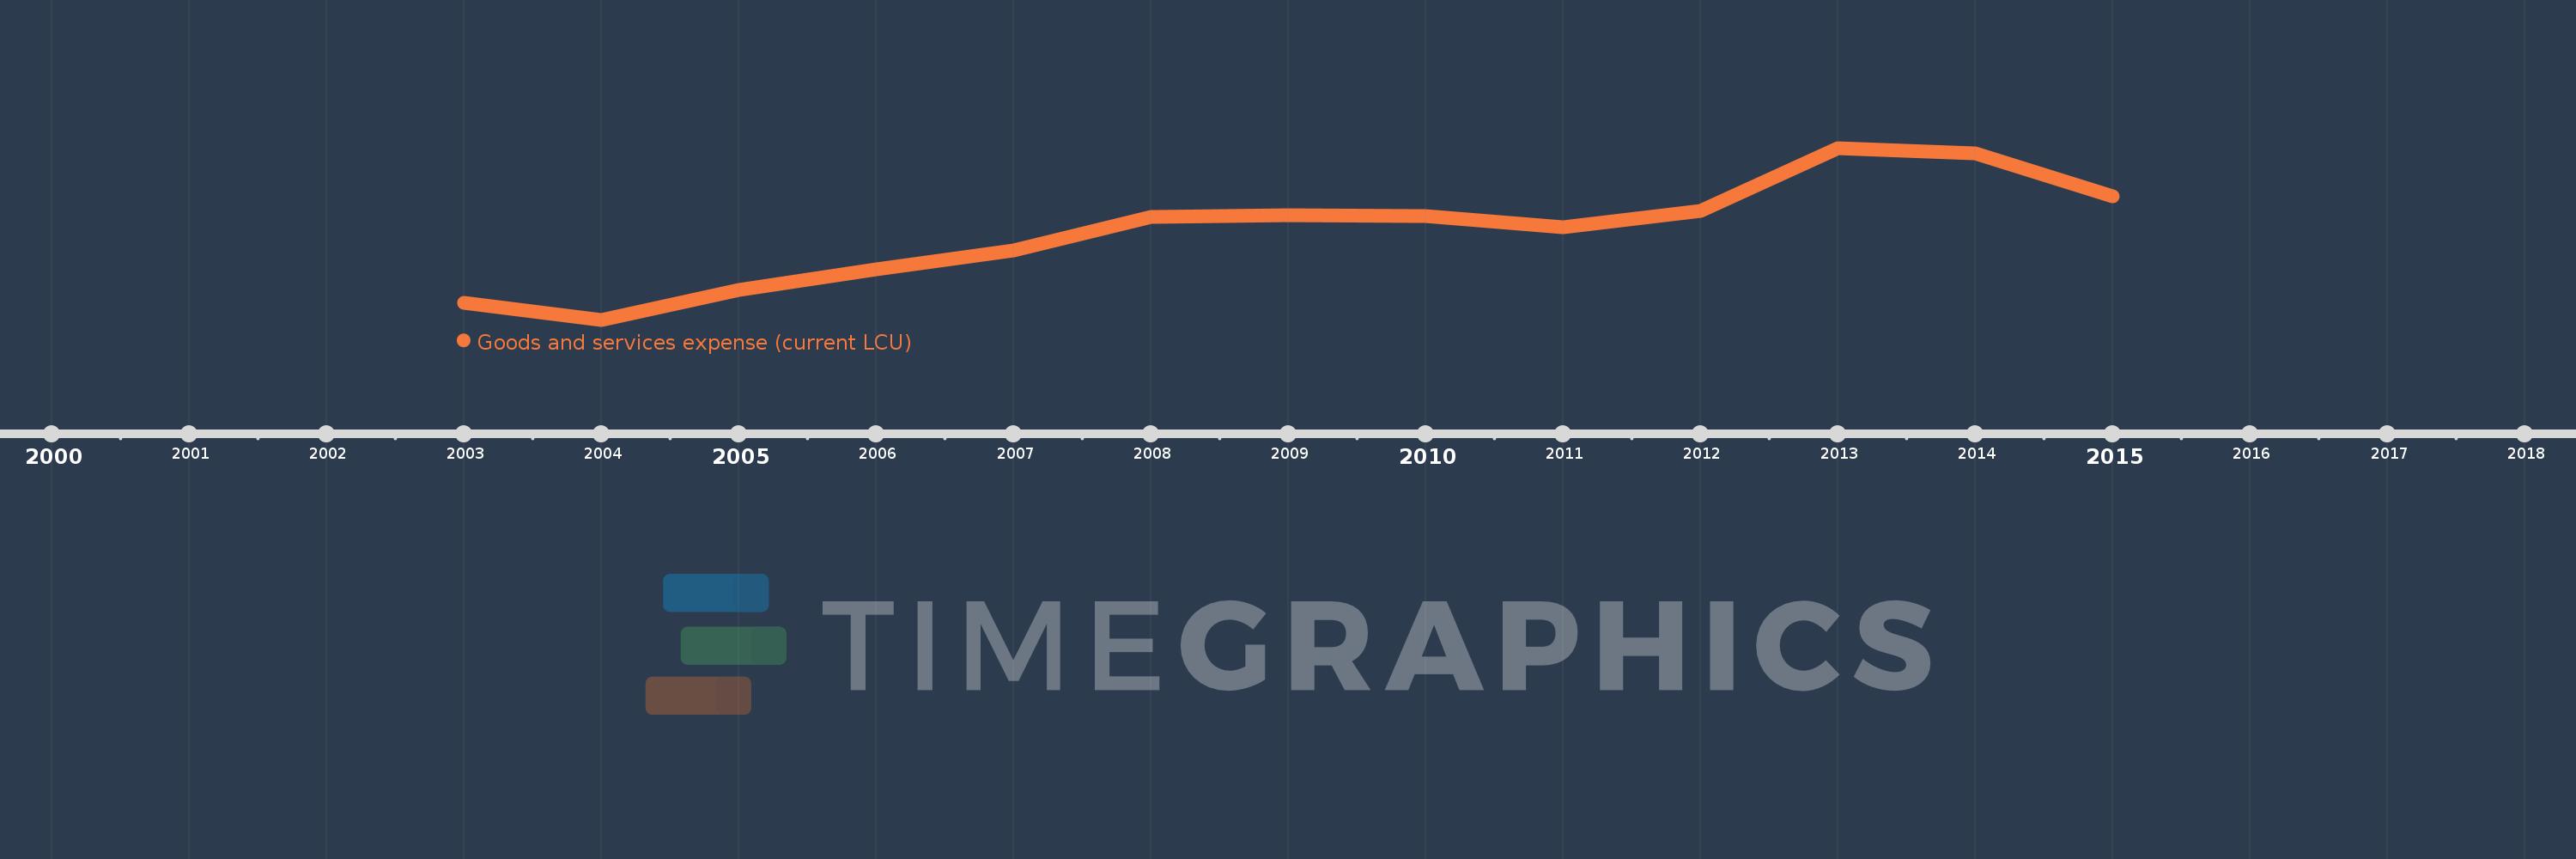
Goods and services expense (current LCU)
2015,2014,2013,2012,2011,2010,2009,2008,2007,2006,2005,2004,2003
This statistics in other country:
AfghanistanAlbaniaAlgeriaAngolaAntigua and BarbudaArmeniaAustraliaAustriaAzerbaijanBahamas, TheBahrainBangladeshBarbadosBelarusBelgiumBelizeBeninBhutanBoliviaBosnia and HerzegovinaBotswanaBrazilBulgariaBurkina FasoBurundiCabo VerdeCambodiaCanadaCentral African RepublicChileColombiaCongo, Dem. Rep.Congo, Rep.Costa RicaCote d'IvoireCroatiaCyprusCzech RepublicDenmarkDominicaDominican RepublicEgypt, Arab Rep.El SalvadorEquatorial GuineaEstoniaEthiopiaFijiFinlandFranceGambia, TheGeorgiaGermanyGhanaGreeceGrenadaGuatemalaHondurasHong Kong SAR, ChinaHungaryIcelandIndiaIndonesiaIran, Islamic Rep.IraqIrelandIsraelItalyJamaicaJapanJordanKazakhstanKenyaKiribatiKorea, Rep.KuwaitKyrgyz RepublicLao PDRLatviaLebanonLesothoLiberiaLithuaniaLuxembourgMacao SAR, ChinaMacedonia, FYRMadagascarMalawiMalaysiaMaldivesMaliMaltaMauritiusMexicoMicronesia, Fed. Sts.MoldovaMongoliaMoroccoMozambiqueNamibiaNepalNetherlandsNew ZealandNicaraguaNigeriaNorwayOmanPakistanPanamaPapua New GuineaParaguayPeruPhilippinesPolandPortugalQatarRomaniaRussian FederationRwandaSamoaSan MarinoSao Tome and PrincipeSenegalSerbiaSeychellesSierra LeoneSingaporeSlovak RepublicSloveniaSolomon IslandsSouth AfricaSpainSri LankaSt. Kitts and NevisSt. LuciaSurinameSwazilandSwedenSwitzerlandSyrian Arab RepublicTajikistanTanzaniaThailandTimor-LesteTogoTrinidad and TobagoTunisiaTurkeyUgandaUkraineUnited Arab EmiratesUnited KingdomUnited StatesUruguayVanuatuVenezuela, RBWest Bank and GazaYemen, Rep.ZambiaZimbabwe Timeline:
This timeline shows a graph from 2003 to 2015 of Burkina Faso. No data until 2002. Number of actual observations by date: 13.
Source name:
World Development Indicators
Source organization:
International Monetary Fund, Government Finance Statistics Yearbook and data files.
Categories, topics:
Public Sector
Last updated:
apr 23, 2017
Indicators value changes by year
Minimum:
56.255 bln
jan 1, 2004
Maximum:
120.571 bln
jan 1, 2013
At the date of observation
Value
Absolute change
Change from previous value
jan 1, 2003
62.503 bln
+62.503 bln
0.0%
jan 1, 2004
56.255 bln
-6.248 bln
-10.0%
jan 1, 2005
67.315 bln
+11.059 bln
19.66%
jan 1, 2006
75.106 bln
+7.791 bln
11.57%
jan 1, 2007
82.189 bln
+7.083 bln
9.43%
jan 1, 2008
94.838 bln
+12.649 bln
15.39%
jan 1, 2009
95.309 bln
+471.107 mln
0.5%
jan 1, 2010
95.12 bln
-188.635 mln
-0.2%
jan 1, 2011
90.764 bln
-4.356 bln
-4.58%
jan 1, 2012
97.144 bln
+6.38 bln
7.03%
jan 1, 2013
120.571 bln
+23.427 bln
24.12%
jan 1, 2014
118.596 bln
-1.975 bln
-1.64%
jan 1, 2015
102.374 bln
-16.222 bln
-13.68%
Ranking of countries by current statistics by years


Comments: