29
/
en
AIzaSyAYiBZKx7MnpbEhh9jyipgxe19OcubqV5w
April 1, 2024
250805
St. Lucia
LCA
true
2
1
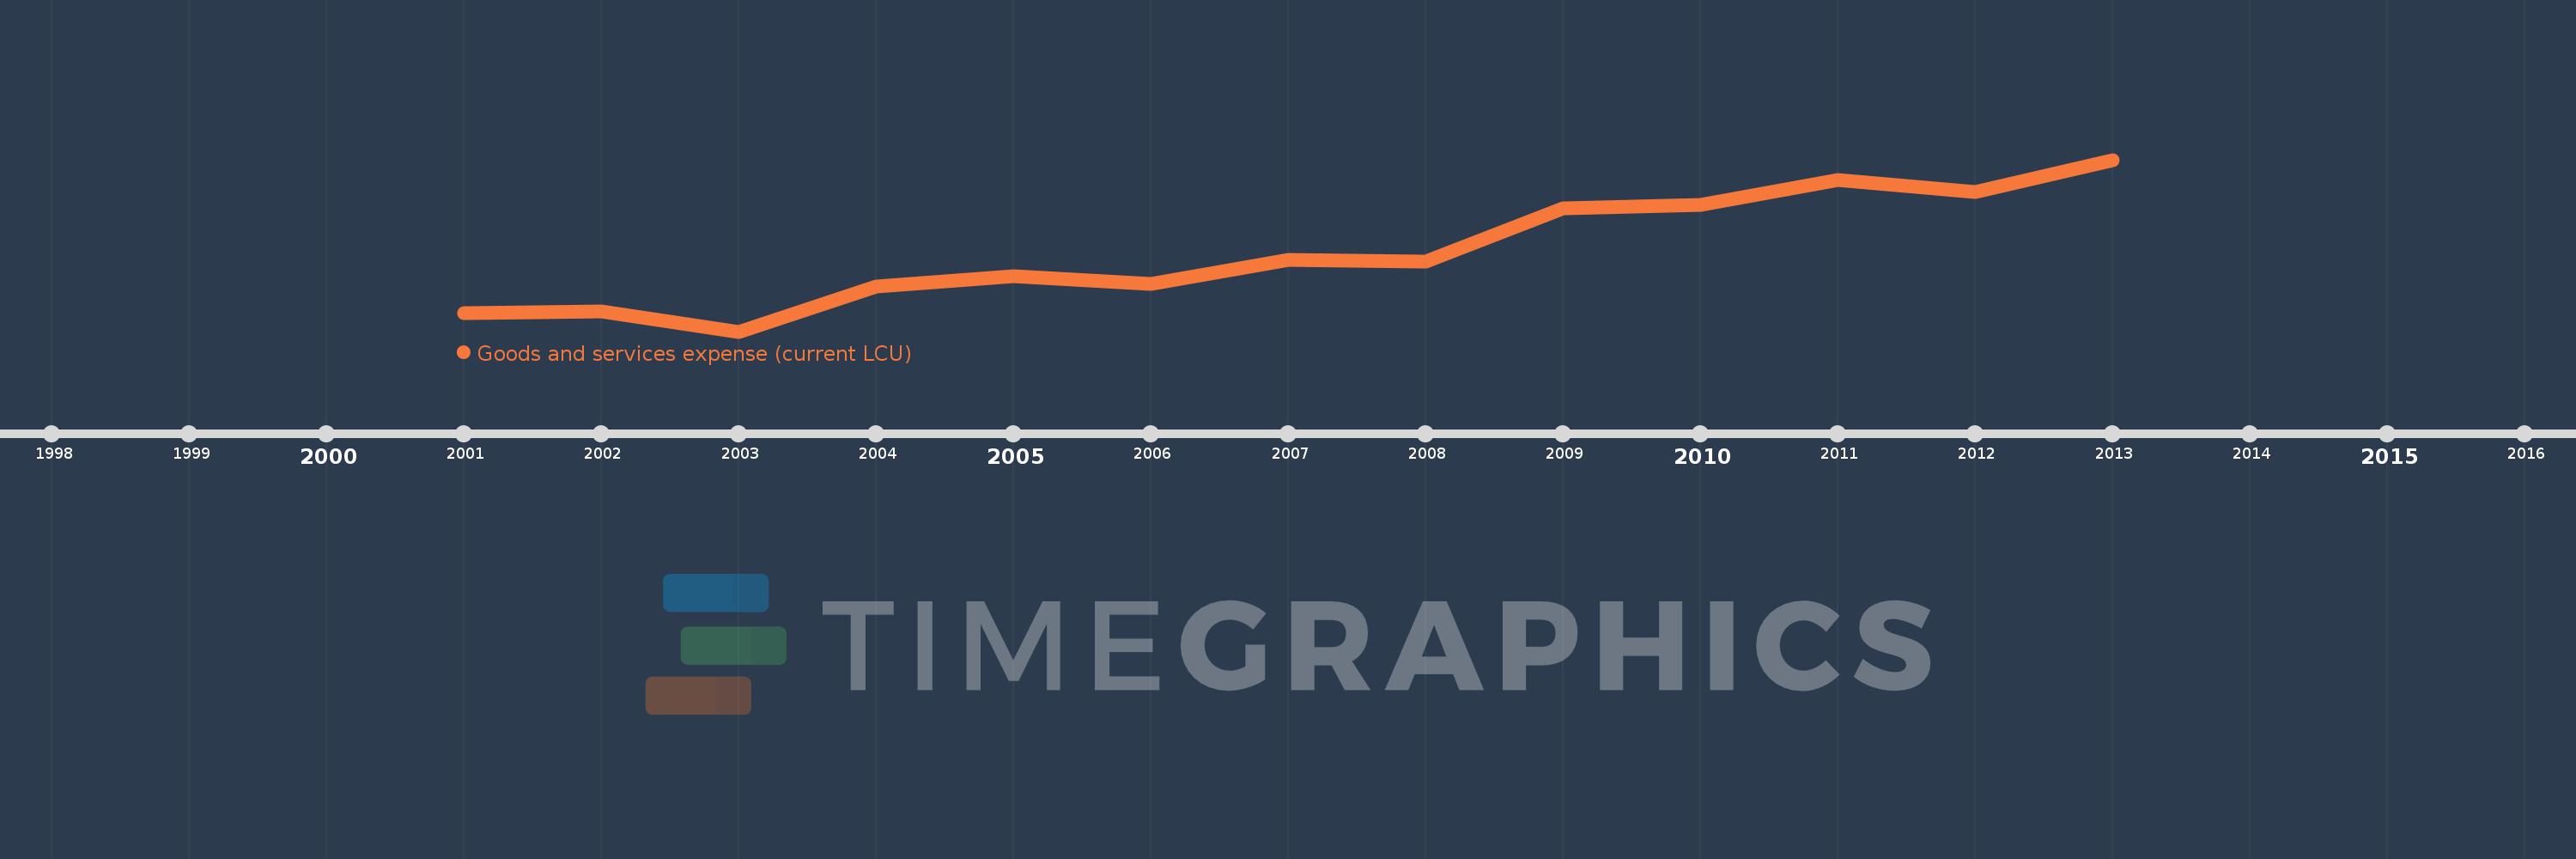
Goods and services expense (current LCU)
2013,2012,2011,2010,2009,2008,2007,2006,2005,2004,2003,2002,2001
This statistics in other country:
AfghanistanAlbaniaAlgeriaAngolaAntigua and BarbudaArmeniaAustraliaAustriaAzerbaijanBahamas, TheBahrainBangladeshBarbadosBelarusBelgiumBelizeBeninBhutanBoliviaBosnia and HerzegovinaBotswanaBrazilBulgariaBurkina FasoBurundiCabo VerdeCambodiaCanadaCentral African RepublicChileColombiaCongo, Dem. Rep.Congo, Rep.Costa RicaCote d'IvoireCroatiaCyprusCzech RepublicDenmarkDominicaDominican RepublicEgypt, Arab Rep.El SalvadorEquatorial GuineaEstoniaEthiopiaFijiFinlandFranceGambia, TheGeorgiaGermanyGhanaGreeceGrenadaGuatemalaHondurasHong Kong SAR, ChinaHungaryIcelandIndiaIndonesiaIran, Islamic Rep.IraqIrelandIsraelItalyJamaicaJapanJordanKazakhstanKenyaKiribatiKorea, Rep.KuwaitKyrgyz RepublicLao PDRLatviaLebanonLesothoLiberiaLithuaniaLuxembourgMacao SAR, ChinaMacedonia, FYRMadagascarMalawiMalaysiaMaldivesMaliMaltaMauritiusMexicoMicronesia, Fed. Sts.MoldovaMongoliaMoroccoMozambiqueNamibiaNepalNetherlandsNew ZealandNicaraguaNigeriaNorwayOmanPakistanPanamaPapua New GuineaParaguayPeruPhilippinesPolandPortugalQatarRomaniaRussian FederationRwandaSamoaSan MarinoSao Tome and PrincipeSenegalSerbiaSeychellesSierra LeoneSingaporeSlovak RepublicSloveniaSolomon IslandsSouth AfricaSpainSri LankaSt. Kitts and NevisSt. LuciaSurinameSwazilandSwedenSwitzerlandSyrian Arab RepublicTajikistanTanzaniaThailandTimor-LesteTogoTrinidad and TobagoTunisiaTurkeyUgandaUkraineUnited Arab EmiratesUnited KingdomUnited StatesUruguayVanuatuVenezuela, RBWest Bank and GazaYemen, Rep.ZambiaZimbabwe Timeline:
This timeline shows a graph from 2001 to 2013 of St. Lucia. No data until 2000. Number of actual observations by date: 13.
Source name:
World Development Indicators
Source organization:
International Monetary Fund, Government Finance Statistics Yearbook and data files.
Categories, topics:
Public Sector
Last updated:
apr 23, 2017
Indicators value changes by year
Minimum:
64.7 mln
jan 1, 2003
Maximum:
159.8 mln
jan 1, 2013
At the date of observation
Value
Absolute change
Change from previous value
jan 1, 2001
75.1 mln
+75.1 mln
0.0%
jan 1, 2002
75.7 mln
+600.0K
0.8%
jan 1, 2003
64.7 mln
-11.0 mln
-14.53%
jan 1, 2004
89.5 mln
+24.8 mln
38.33%
jan 1, 2005
95.5 mln
+6.0 mln
6.7%
jan 1, 2006
91.0 mln
-4.5 mln
-4.71%
jan 1, 2007
104.3 mln
+13.3 mln
14.62%
jan 1, 2008
103.5 mln
-800.0K
-0.77%
jan 1, 2009
133.1 mln
+29.6 mln
28.6%
jan 1, 2010
135.0 mln
+1.9 mln
1.43%
jan 1, 2011
148.7 mln
+13.7 mln
10.15%
jan 1, 2012
141.8 mln
-6.9 mln
-4.64%
jan 1, 2013
159.8 mln
+18.0 mln
12.69%
Ranking of countries by current statistics by years


Comments: