29
/
en
AIzaSyAYiBZKx7MnpbEhh9jyipgxe19OcubqV5w
April 1, 2024
129380
Estonia
EST
true
2
1
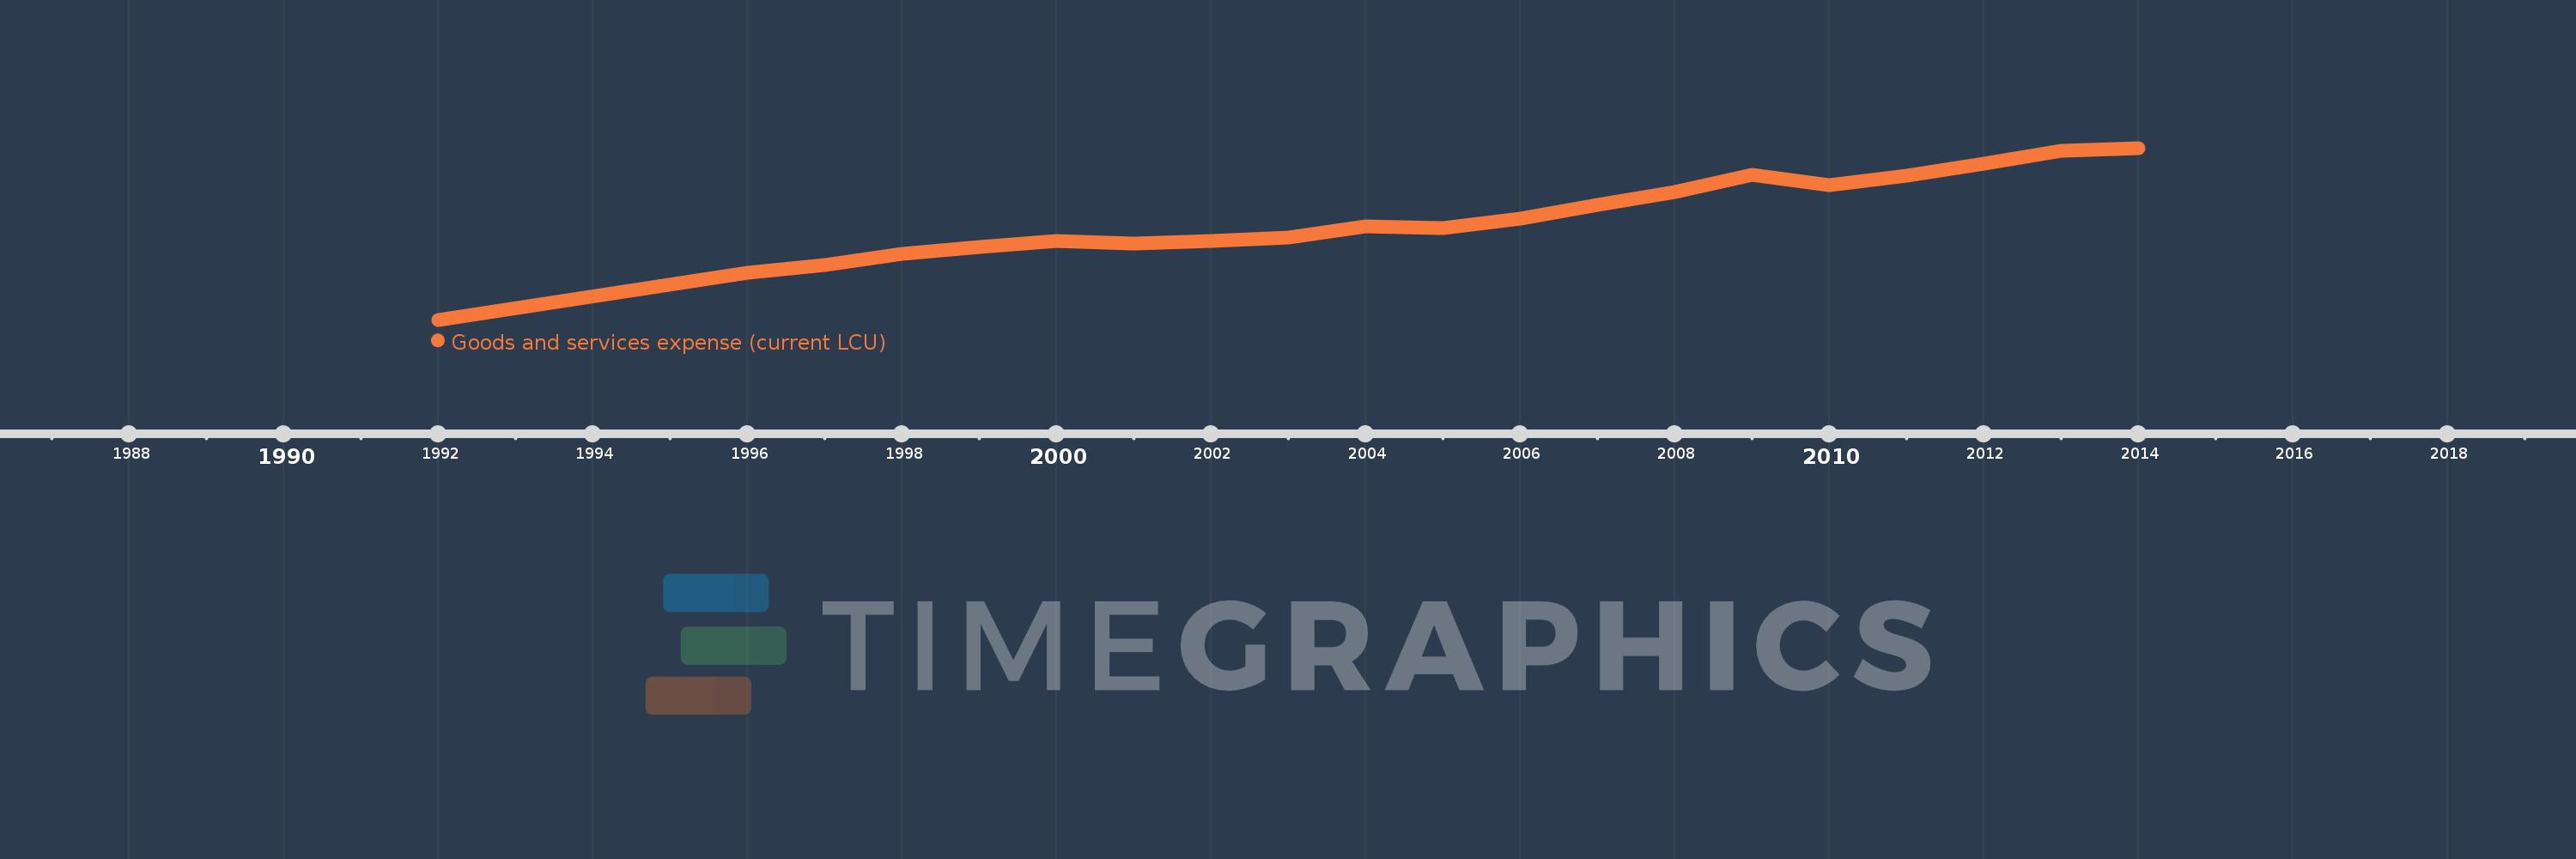
Goods and services expense (current LCU)
2014,2013,2012,2011,2010,2009,2008,2007,2006,2005,2004,2003,2002,2001,2000,1999,1998,1997,1996,1992
This statistics in other country:
AfghanistanAlbaniaAlgeriaAngolaAntigua and BarbudaArmeniaAustraliaAustriaAzerbaijanBahamas, TheBahrainBangladeshBarbadosBelarusBelgiumBelizeBeninBhutanBoliviaBosnia and HerzegovinaBotswanaBrazilBulgariaBurkina FasoBurundiCabo VerdeCambodiaCanadaCentral African RepublicChileColombiaCongo, Dem. Rep.Congo, Rep.Costa RicaCote d'IvoireCroatiaCyprusCzech RepublicDenmarkDominicaDominican RepublicEgypt, Arab Rep.El SalvadorEquatorial GuineaEstoniaEthiopiaFijiFinlandFranceGambia, TheGeorgiaGermanyGhanaGreeceGrenadaGuatemalaHondurasHong Kong SAR, ChinaHungaryIcelandIndiaIndonesiaIran, Islamic Rep.IraqIrelandIsraelItalyJamaicaJapanJordanKazakhstanKenyaKiribatiKorea, Rep.KuwaitKyrgyz RepublicLao PDRLatviaLebanonLesothoLiberiaLithuaniaLuxembourgMacao SAR, ChinaMacedonia, FYRMadagascarMalawiMalaysiaMaldivesMaliMaltaMauritiusMexicoMicronesia, Fed. Sts.MoldovaMongoliaMoroccoMozambiqueNamibiaNepalNetherlandsNew ZealandNicaraguaNigeriaNorwayOmanPakistanPanamaPapua New GuineaParaguayPeruPhilippinesPolandPortugalQatarRomaniaRussian FederationRwandaSamoaSan MarinoSao Tome and PrincipeSenegalSerbiaSeychellesSierra LeoneSingaporeSlovak RepublicSloveniaSolomon IslandsSouth AfricaSpainSri LankaSt. Kitts and NevisSt. LuciaSurinameSwazilandSwedenSwitzerlandSyrian Arab RepublicTajikistanTanzaniaThailandTimor-LesteTogoTrinidad and TobagoTunisiaTurkeyUgandaUkraineUnited Arab EmiratesUnited KingdomUnited StatesUruguayVanuatuVenezuela, RBWest Bank and GazaYemen, Rep.ZambiaZimbabwe Timeline:
This timeline shows a graph from 1992 to 2014 of Estonia. No data until 1991. Number of actual observations by date: 20.
Source name:
World Development Indicators
Source organization:
International Monetary Fund, Government Finance Statistics Yearbook and data files.
Categories, topics:
Public Sector
Last updated:
apr 23, 2017
Indicators value changes by year
Minimum:
285.52K
jan 1, 1992
Maximum:
44.7 mln
jan 1, 2014
At the date of observation
Value
Absolute change
Change from previous value
jan 1, 1992
285.52K
+285.52K
0.0%
jan 1, 1996
12.354 mln
+12.069 mln
4.23K%
jan 1, 1997
14.463 mln
+2.109 mln
17.07%
jan 1, 1998
17.256 mln
+2.793 mln
19.31%
jan 1, 1999
19.046 mln
+1.79 mln
10.37%
jan 1, 2000
20.637 mln
+1.591 mln
8.36%
jan 1, 2001
19.979 mln
-658.29K
-3.19%
jan 1, 2002
20.618 mln
+639.116K
3.2%
jan 1, 2003
21.557 mln
+939.501K
4.56%
jan 1, 2004
24.427 mln
+2.87 mln
13.31%
jan 1, 2005
23.954 mln
-472.946K
-1.94%
jan 1, 2006
26.447 mln
+2.493 mln
10.41%
jan 1, 2007
30.032 mln
+3.585 mln
13.56%
jan 1, 2008
33.221 mln
+3.189 mln
10.62%
jan 1, 2009
37.778 mln
+4.557 mln
13.72%
jan 1, 2010
35.056 mln
-2.723 mln
-7.21%
jan 1, 2011
37.516 mln
+2.461 mln
7.02%
jan 1, 2012
40.629 mln
+3.112 mln
8.3%
jan 1, 2013
44.054 mln
+3.426 mln
8.43%
jan 1, 2014
44.7 mln
+645.508K
1.47%
Ranking of countries by current statistics by years


Comments: