29
/
en
AIzaSyAYiBZKx7MnpbEhh9jyipgxe19OcubqV5w
April 1, 2024
272274
Uganda
UGA
true
2
1
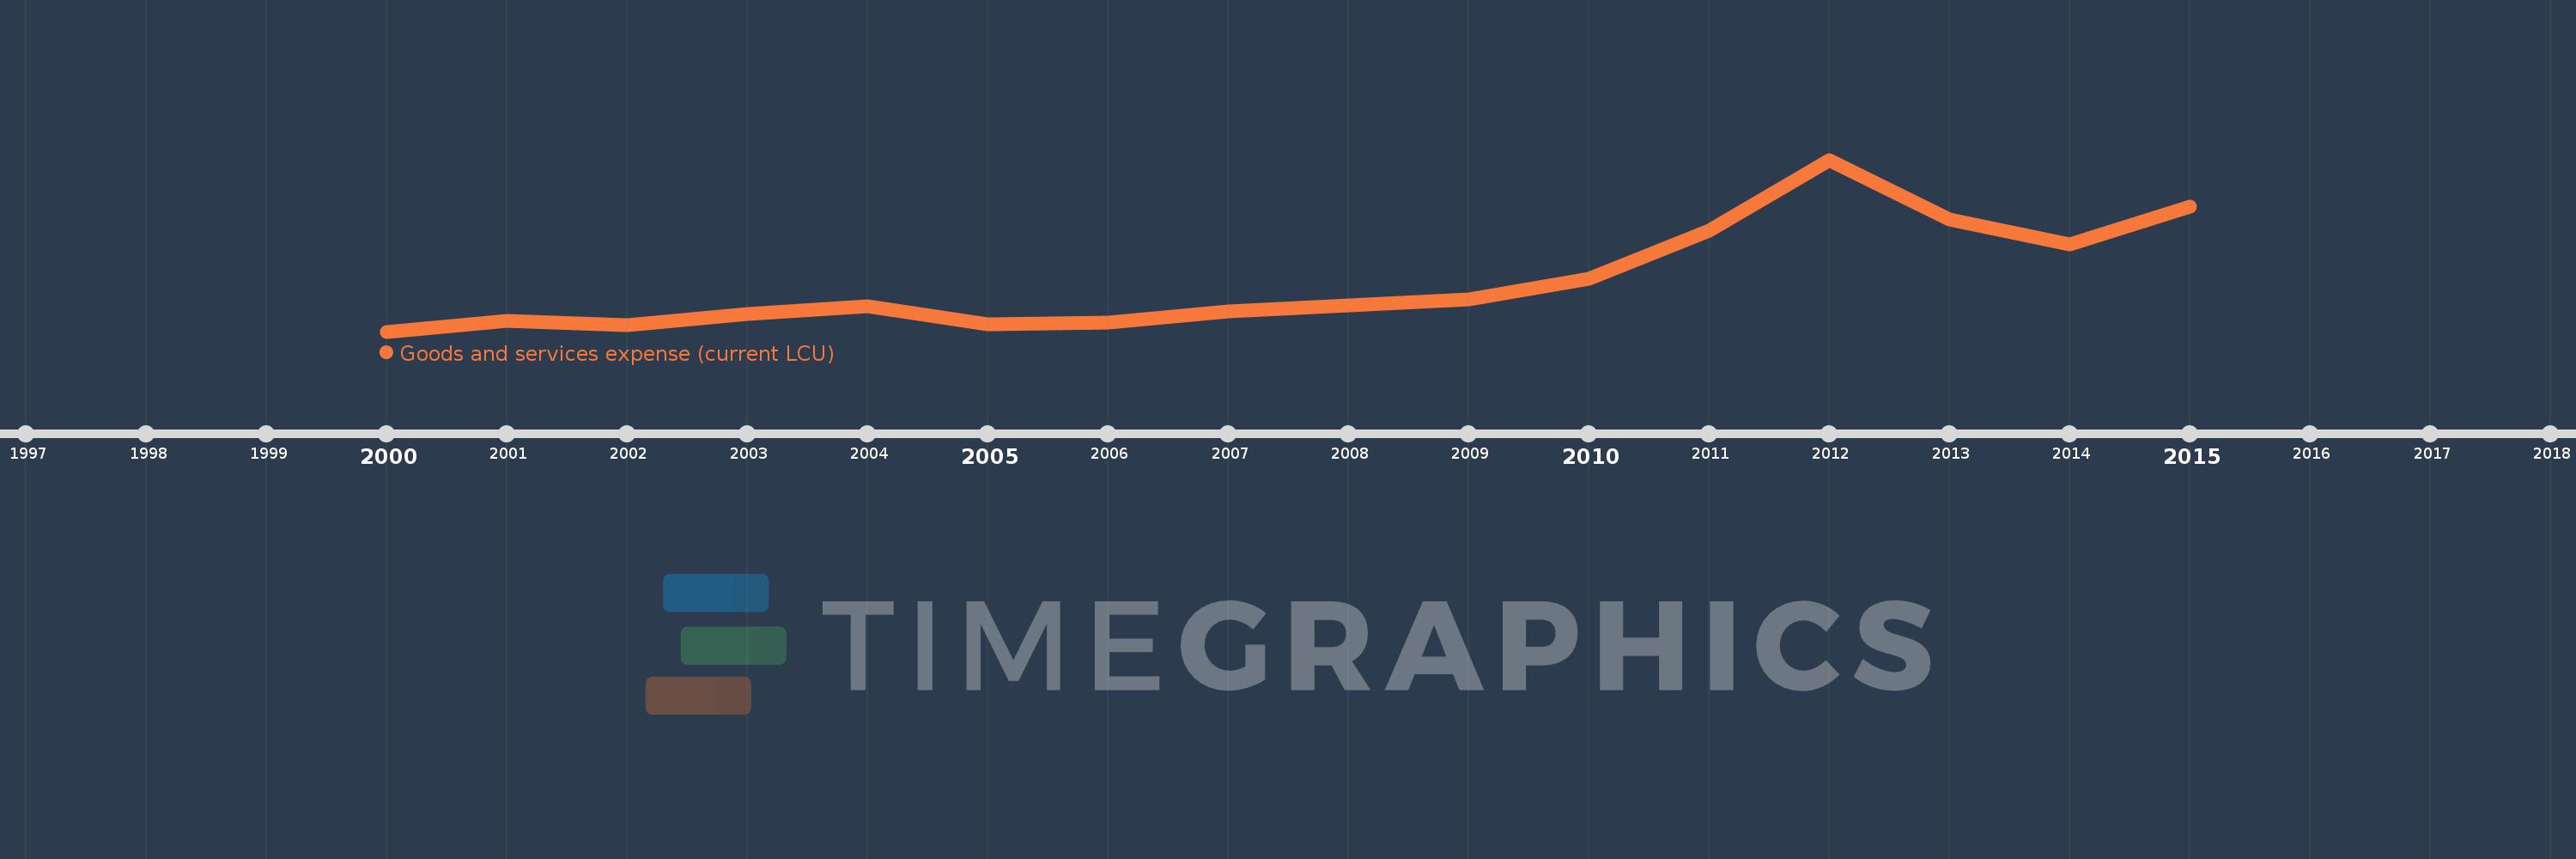
Goods and services expense (current LCU)
2015,2014,2013,2012,2011,2010,2009,2008,2007,2006,2005,2004,2003,2002,2001,2000
This statistics in other country:
AfghanistanAlbaniaAlgeriaAngolaAntigua and BarbudaArmeniaAustraliaAustriaAzerbaijanBahamas, TheBahrainBangladeshBarbadosBelarusBelgiumBelizeBeninBhutanBoliviaBosnia and HerzegovinaBotswanaBrazilBulgariaBurkina FasoBurundiCabo VerdeCambodiaCanadaCentral African RepublicChileColombiaCongo, Dem. Rep.Congo, Rep.Costa RicaCote d'IvoireCroatiaCyprusCzech RepublicDenmarkDominicaDominican RepublicEgypt, Arab Rep.El SalvadorEquatorial GuineaEstoniaEthiopiaFijiFinlandFranceGambia, TheGeorgiaGermanyGhanaGreeceGrenadaGuatemalaHondurasHong Kong SAR, ChinaHungaryIcelandIndiaIndonesiaIran, Islamic Rep.IraqIrelandIsraelItalyJamaicaJapanJordanKazakhstanKenyaKiribatiKorea, Rep.KuwaitKyrgyz RepublicLao PDRLatviaLebanonLesothoLiberiaLithuaniaLuxembourgMacao SAR, ChinaMacedonia, FYRMadagascarMalawiMalaysiaMaldivesMaliMaltaMauritiusMexicoMicronesia, Fed. Sts.MoldovaMongoliaMoroccoMozambiqueNamibiaNepalNetherlandsNew ZealandNicaraguaNigeriaNorwayOmanPakistanPanamaPapua New GuineaParaguayPeruPhilippinesPolandPortugalQatarRomaniaRussian FederationRwandaSamoaSan MarinoSao Tome and PrincipeSenegalSerbiaSeychellesSierra LeoneSingaporeSlovak RepublicSloveniaSolomon IslandsSouth AfricaSpainSri LankaSt. Kitts and NevisSt. LuciaSurinameSwazilandSwedenSwitzerlandSyrian Arab RepublicTajikistanTanzaniaThailandTimor-LesteTogoTrinidad and TobagoTunisiaTurkeyUgandaUkraineUnited Arab EmiratesUnited KingdomUnited StatesUruguayVanuatuVenezuela, RBWest Bank and GazaYemen, Rep.ZambiaZimbabwe Timeline:
This timeline shows a graph from 2000 to 2015 of Uganda. No data until 1999. Number of actual observations by date: 16.
Source name:
World Development Indicators
Source organization:
International Monetary Fund, Government Finance Statistics Yearbook and data files.
Categories, topics:
Public Sector
Last updated:
apr 23, 2017
Indicators value changes by year
Minimum:
668.424 bln
jan 1, 2000
Maximum:
2.716 trl
jan 1, 2012
At the date of observation
Value
Absolute change
Change from previous value
jan 1, 2000
668.424 bln
+668.424 bln
0.0%
jan 1, 2001
801.398 bln
+132.974 bln
19.89%
jan 1, 2002
743.403 bln
-57.995 bln
-7.24%
jan 1, 2003
878.023 bln
+134.62 bln
18.11%
jan 1, 2004
971.609 bln
+93.585 bln
10.66%
jan 1, 2005
750.652 bln
-220.957 bln
-22.74%
jan 1, 2006
780.741 bln
+30.088 bln
4.01%
jan 1, 2007
911.08 bln
+130.339 bln
16.69%
jan 1, 2008
981.957 bln
+70.877 bln
7.78%
jan 1, 2009
1.049 trl
+67.44 bln
6.87%
jan 1, 2010
1.301 trl
+251.336 bln
23.95%
jan 1, 2011
1.874 trl
+573.317 bln
44.08%
jan 1, 2012
2.716 trl
+842.162 bln
44.94%
jan 1, 2013
2.001 trl
-715.035 bln
-26.32%
jan 1, 2014
1.709 trl
-292.227 bln
-14.6%
jan 1, 2015
2.16 trl
+450.727 bln
26.37%
Ranking of countries by current statistics by years


Comments: