29
/
en
AIzaSyAYiBZKx7MnpbEhh9jyipgxe19OcubqV5w
April 1, 2024
132026
Fiji
FJI
true
2
1
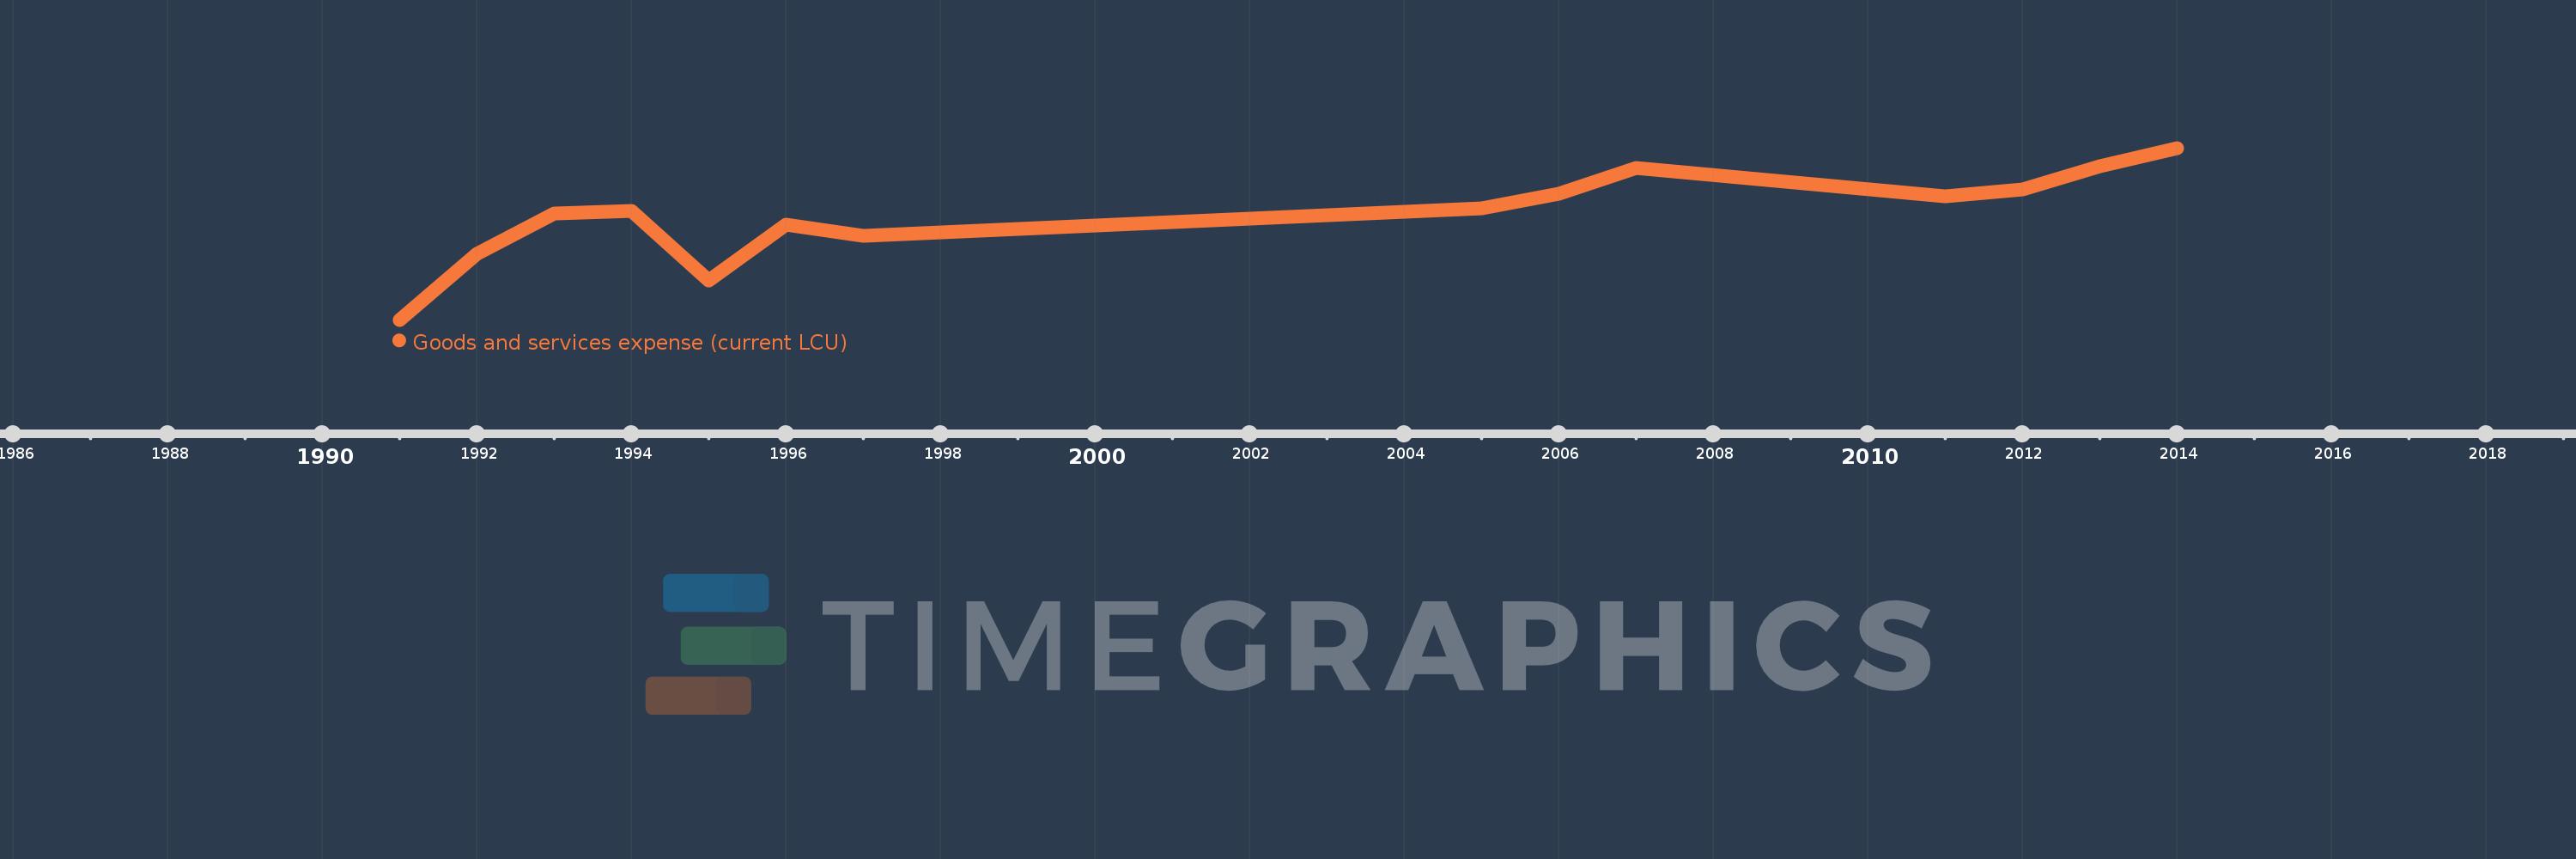
Goods and services expense (current LCU)
2014,2013,2012,2011,2007,2006,2005,1997,1996,1995,1994,1993,1992,1991
This statistics in other country:
AfghanistanAlbaniaAlgeriaAngolaAntigua and BarbudaArmeniaAustraliaAustriaAzerbaijanBahamas, TheBahrainBangladeshBarbadosBelarusBelgiumBelizeBeninBhutanBoliviaBosnia and HerzegovinaBotswanaBrazilBulgariaBurkina FasoBurundiCabo VerdeCambodiaCanadaCentral African RepublicChileColombiaCongo, Dem. Rep.Congo, Rep.Costa RicaCote d'IvoireCroatiaCyprusCzech RepublicDenmarkDominicaDominican RepublicEgypt, Arab Rep.El SalvadorEquatorial GuineaEstoniaEthiopiaFijiFinlandFranceGambia, TheGeorgiaGermanyGhanaGreeceGrenadaGuatemalaHondurasHong Kong SAR, ChinaHungaryIcelandIndiaIndonesiaIran, Islamic Rep.IraqIrelandIsraelItalyJamaicaJapanJordanKazakhstanKenyaKiribatiKorea, Rep.KuwaitKyrgyz RepublicLao PDRLatviaLebanonLesothoLiberiaLithuaniaLuxembourgMacao SAR, ChinaMacedonia, FYRMadagascarMalawiMalaysiaMaldivesMaliMaltaMauritiusMexicoMicronesia, Fed. Sts.MoldovaMongoliaMoroccoMozambiqueNamibiaNepalNetherlandsNew ZealandNicaraguaNigeriaNorwayOmanPakistanPanamaPapua New GuineaParaguayPeruPhilippinesPolandPortugalQatarRomaniaRussian FederationRwandaSamoaSan MarinoSao Tome and PrincipeSenegalSerbiaSeychellesSierra LeoneSingaporeSlovak RepublicSloveniaSolomon IslandsSouth AfricaSpainSri LankaSt. Kitts and NevisSt. LuciaSurinameSwazilandSwedenSwitzerlandSyrian Arab RepublicTajikistanTanzaniaThailandTimor-LesteTogoTrinidad and TobagoTunisiaTurkeyUgandaUkraineUnited Arab EmiratesUnited KingdomUnited StatesUruguayVanuatuVenezuela, RBWest Bank and GazaYemen, Rep.ZambiaZimbabwe Timeline:
This timeline shows a graph from 1991 to 2014 of Fiji. No data until 1990. Number of actual observations by date: 14.
Source name:
World Development Indicators
Source organization:
International Monetary Fund, Government Finance Statistics Yearbook and data files.
Categories, topics:
Public Sector
Last updated:
apr 23, 2017
Indicators value changes by year
Minimum:
38.72 mln
jan 1, 1991
Maximum:
260.31 mln
jan 1, 2014
At the date of observation
Value
Absolute change
Change from previous value
jan 1, 1991
38.72 mln
+38.72 mln
0.0%
jan 1, 1992
124.06 mln
+85.34 mln
220.4%
jan 1, 1993
176.14 mln
+52.08 mln
41.98%
jan 1, 1994
178.76 mln
+2.62 mln
1.49%
jan 1, 1995
88.87 mln
-89.89 mln
-50.29%
jan 1, 1996
161.51 mln
+72.64 mln
81.74%
jan 1, 1997
146.78 mln
-14.73 mln
-9.12%
jan 1, 2005
182.7 mln
+35.92 mln
24.47%
jan 1, 2006
200.74 mln
+18.04 mln
9.87%
jan 1, 2007
234.171 mln
+33.431 mln
16.65%
jan 1, 2011
197.446 mln
-36.724 mln
-15.68%
jan 1, 2012
206.768 mln
+9.322 mln
4.72%
jan 1, 2013
236.526 mln
+29.758 mln
14.39%
jan 1, 2014
260.31 mln
+23.784 mln
10.06%
Ranking of countries by current statistics by years


Comments: