29
/
en
AIzaSyAYiBZKx7MnpbEhh9jyipgxe19OcubqV5w
April 1, 2024
117934
Czech Republic
CZE
true
2
1
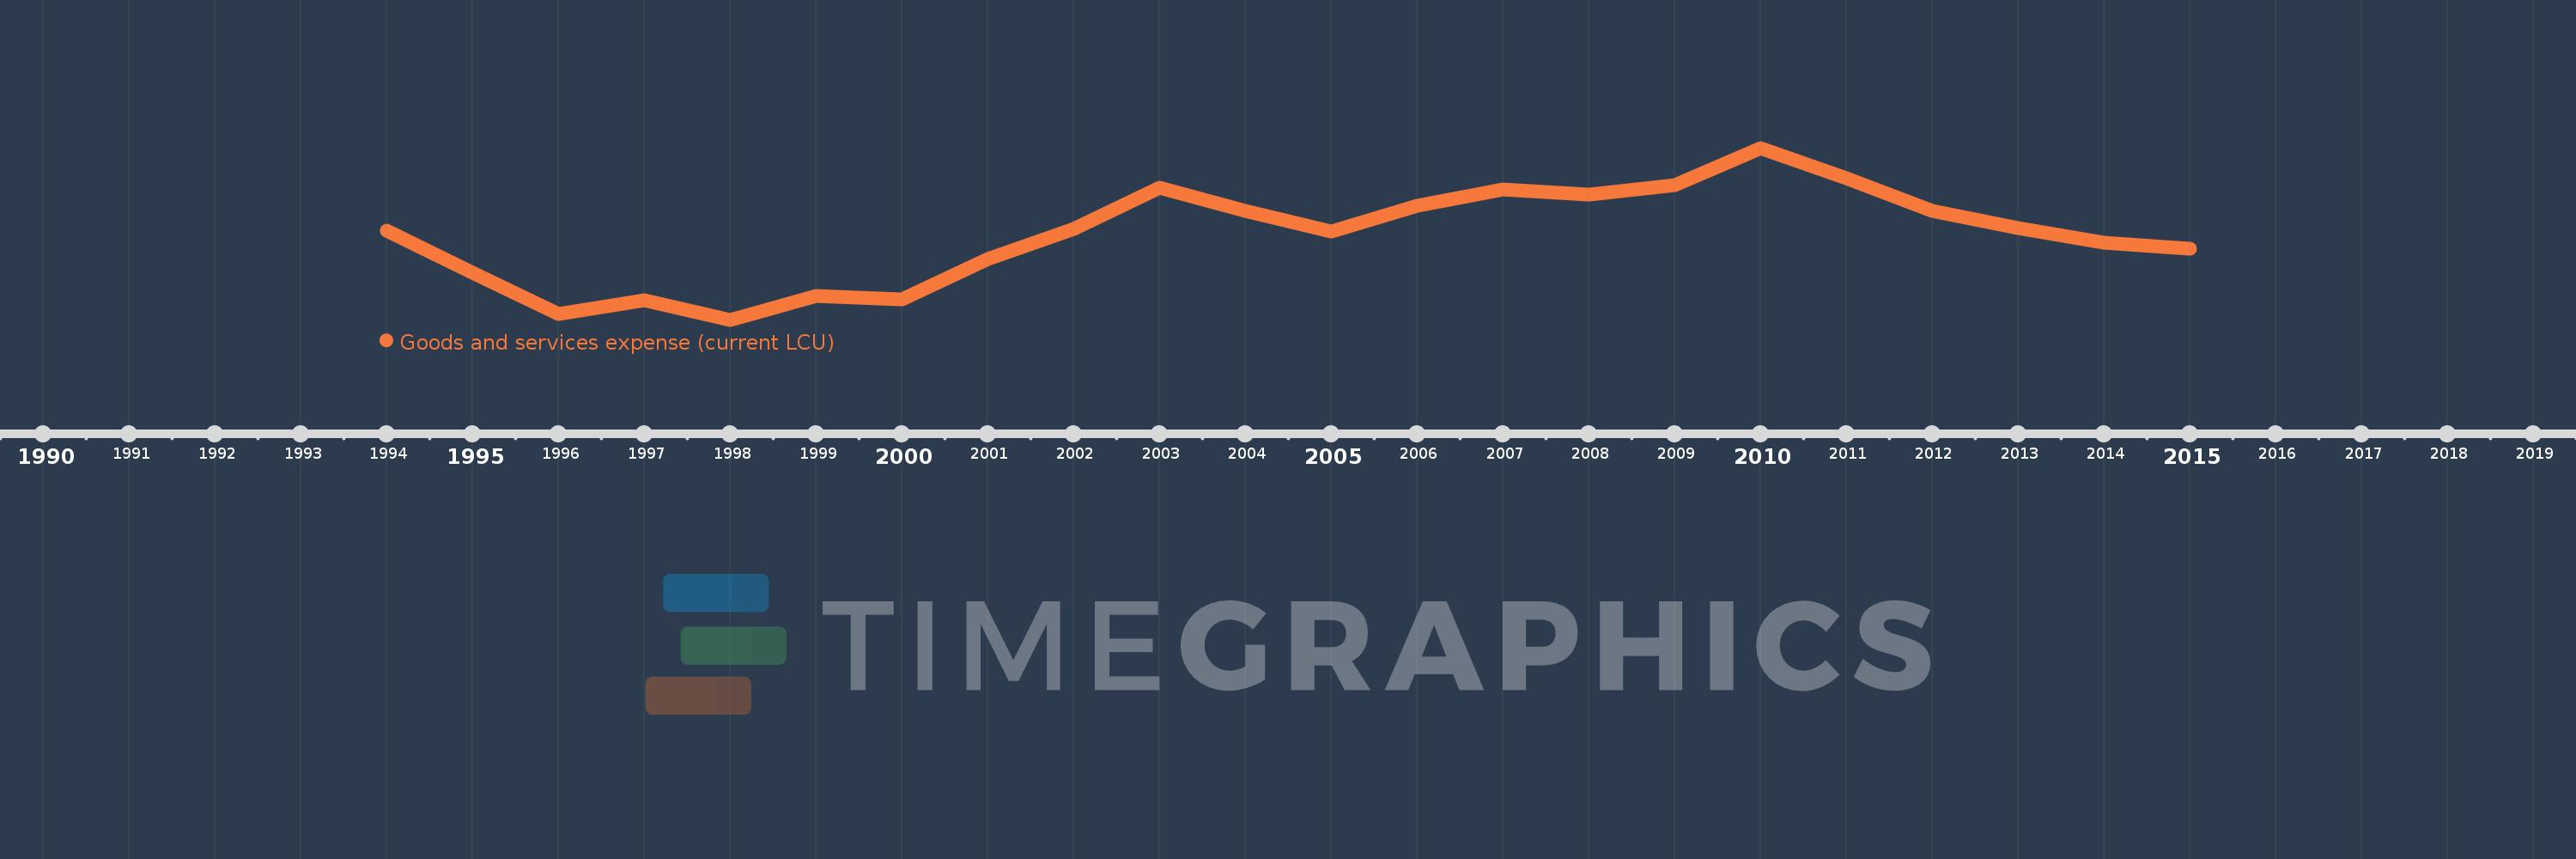
Goods and services expense (current LCU)
2015,2014,2013,2012,2011,2010,2009,2008,2007,2006,2005,2004,2003,2002,2001,2000,1999,1998,1997,1996,1995,1994
This statistics in other country:
AfghanistanAlbaniaAlgeriaAngolaAntigua and BarbudaArmeniaAustraliaAustriaAzerbaijanBahamas, TheBahrainBangladeshBarbadosBelarusBelgiumBelizeBeninBhutanBoliviaBosnia and HerzegovinaBotswanaBrazilBulgariaBurkina FasoBurundiCabo VerdeCambodiaCanadaCentral African RepublicChileColombiaCongo, Dem. Rep.Congo, Rep.Costa RicaCote d'IvoireCroatiaCyprusCzech RepublicDenmarkDominicaDominican RepublicEgypt, Arab Rep.El SalvadorEquatorial GuineaEstoniaEthiopiaFijiFinlandFranceGambia, TheGeorgiaGermanyGhanaGreeceGrenadaGuatemalaHondurasHong Kong SAR, ChinaHungaryIcelandIndiaIndonesiaIran, Islamic Rep.IraqIrelandIsraelItalyJamaicaJapanJordanKazakhstanKenyaKiribatiKorea, Rep.KuwaitKyrgyz RepublicLao PDRLatviaLebanonLesothoLiberiaLithuaniaLuxembourgMacao SAR, ChinaMacedonia, FYRMadagascarMalawiMalaysiaMaldivesMaliMaltaMauritiusMexicoMicronesia, Fed. Sts.MoldovaMongoliaMoroccoMozambiqueNamibiaNepalNetherlandsNew ZealandNicaraguaNigeriaNorwayOmanPakistanPanamaPapua New GuineaParaguayPeruPhilippinesPolandPortugalQatarRomaniaRussian FederationRwandaSamoaSan MarinoSao Tome and PrincipeSenegalSerbiaSeychellesSierra LeoneSingaporeSlovak RepublicSloveniaSolomon IslandsSouth AfricaSpainSri LankaSt. Kitts and NevisSt. LuciaSurinameSwazilandSwedenSwitzerlandSyrian Arab RepublicTajikistanTanzaniaThailandTimor-LesteTogoTrinidad and TobagoTunisiaTurkeyUgandaUkraineUnited Arab EmiratesUnited KingdomUnited StatesUruguayVanuatuVenezuela, RBWest Bank and GazaYemen, Rep.ZambiaZimbabwe Timeline:
This timeline shows a graph from 1994 to 2015 of Czech Republic. No data until 1993. Number of actual observations by date: 22.
Source name:
World Development Indicators
Source organization:
International Monetary Fund, Government Finance Statistics Yearbook and data files.
Categories, topics:
Public Sector
Last updated:
apr 23, 2017
Indicators value changes by year
Minimum:
33.582 bln
jan 1, 1998
Maximum:
83.164 bln
jan 1, 2010
At the date of observation
Value
Absolute change
Change from previous value
jan 1, 1994
59.309 bln
+59.309 bln
0.0%
jan 1, 1995
47.143 bln
-12.166 bln
-20.51%
jan 1, 1996
35.276 bln
-11.867 bln
-25.17%
jan 1, 1997
39.181 bln
+3.905 bln
11.07%
jan 1, 1998
33.582 bln
-5.599 bln
-14.29%
jan 1, 1999
40.491 bln
+6.909 bln
20.57%
jan 1, 2000
39.578 bln
-913.0 mln
-2.25%
jan 1, 2001
51.104 bln
+11.526 bln
29.12%
jan 1, 2002
59.775 bln
+8.671 bln
16.97%
jan 1, 2003
71.662 bln
+11.887 bln
19.89%
jan 1, 2004
65.096 bln
-6.566 bln
-9.16%
jan 1, 2005
59.051 bln
-6.045 bln
-9.29%
jan 1, 2006
66.522 bln
+7.471 bln
12.65%
jan 1, 2007
71.085 bln
+4.563 bln
6.86%
jan 1, 2008
69.616 bln
-1.469 bln
-2.07%
jan 1, 2009
72.416 bln
+2.8 bln
4.02%
jan 1, 2010
83.164 bln
+10.748 bln
14.84%
jan 1, 2011
74.48 bln
-8.684 bln
-10.44%
jan 1, 2012
64.898 bln
-9.582 bln
-12.87%
jan 1, 2013
59.954 bln
-4.944 bln
-7.62%
jan 1, 2014
55.71 bln
-4.244 bln
-7.08%
jan 1, 2015
54.136 bln
-1.574 bln
-2.83%
Ranking of countries by current statistics by years


Comments: