29
/
en
AIzaSyAYiBZKx7MnpbEhh9jyipgxe19OcubqV5w
April 1, 2024
254158
Suriname
SUR
true
2
1
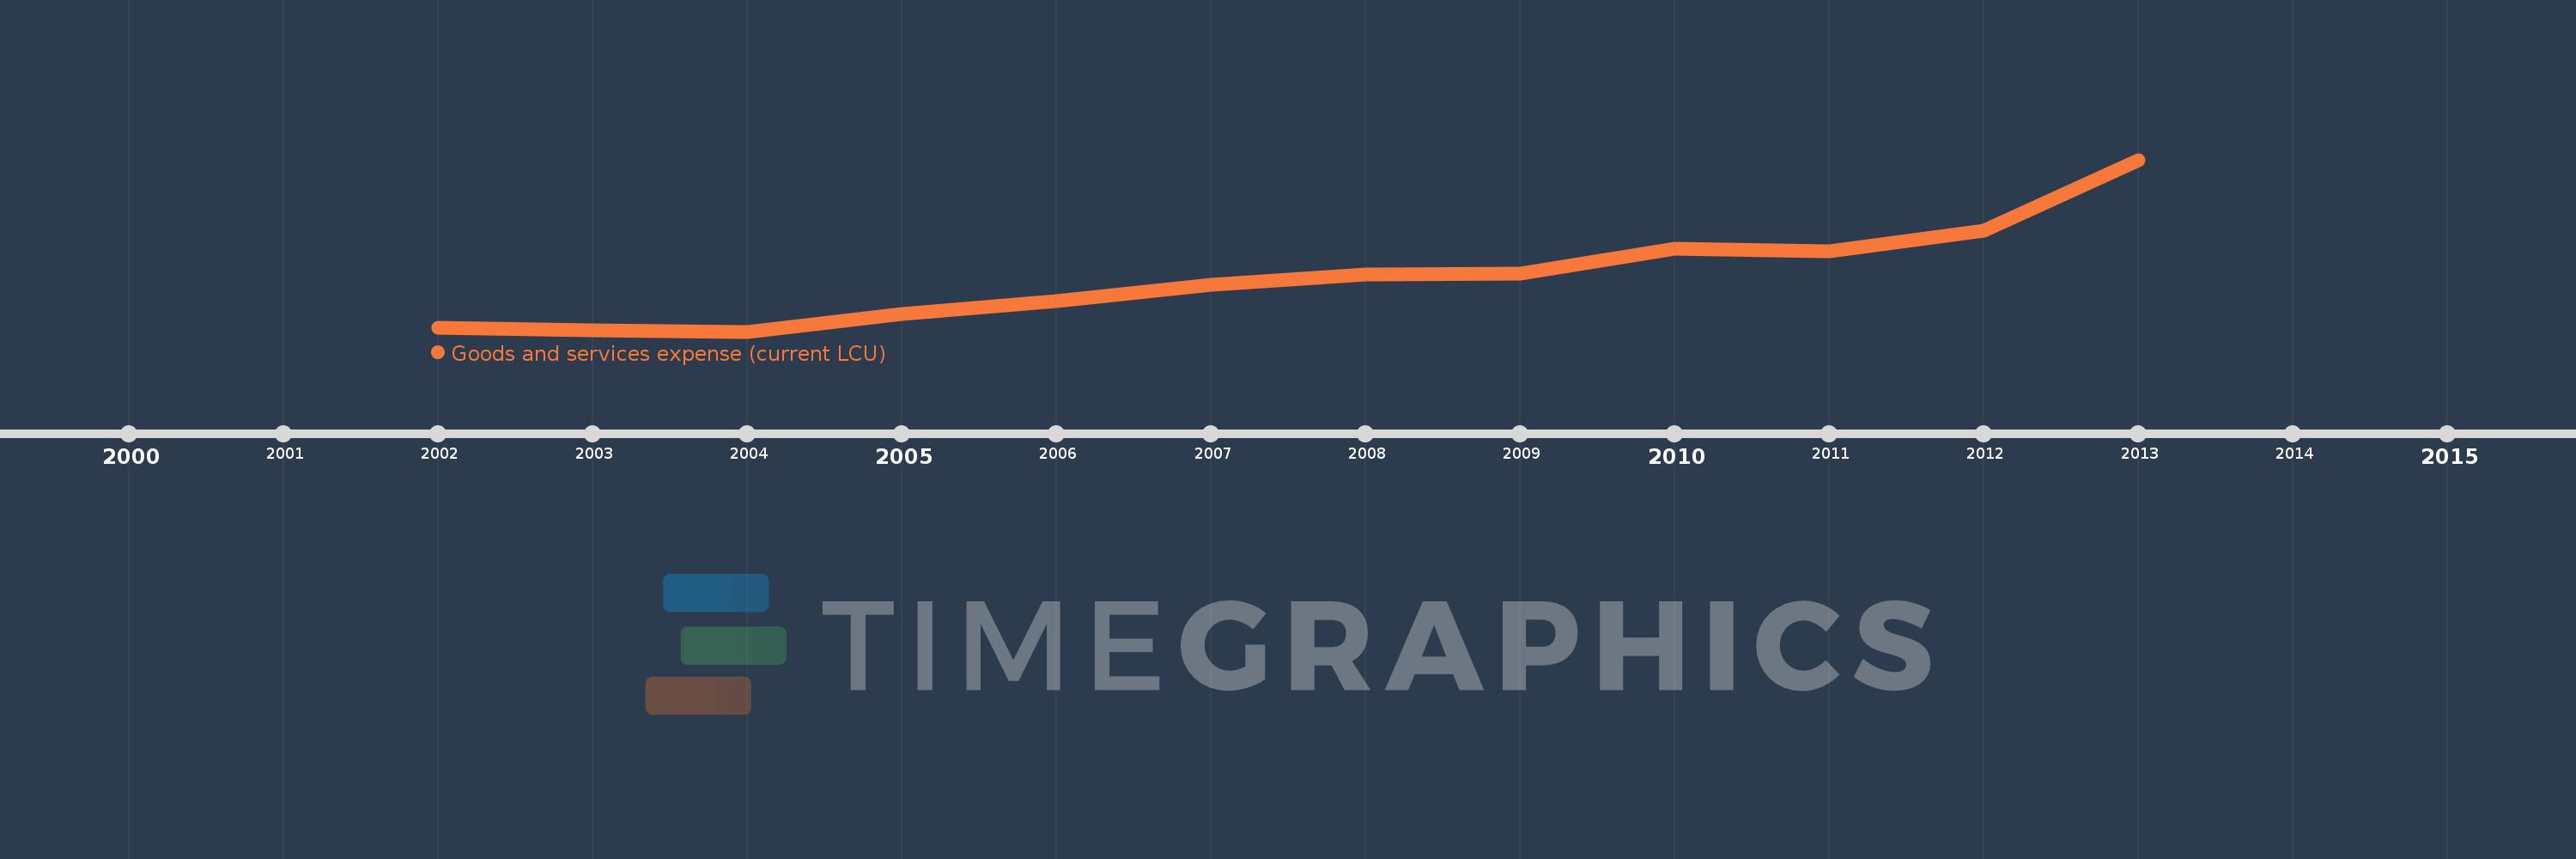
Goods and services expense (current LCU)
2013,2012,2011,2010,2009,2008,2007,2006,2005,2004,2003,2002
This statistics in other country:
AfghanistanAlbaniaAlgeriaAngolaAntigua and BarbudaArmeniaAustraliaAustriaAzerbaijanBahamas, TheBahrainBangladeshBarbadosBelarusBelgiumBelizeBeninBhutanBoliviaBosnia and HerzegovinaBotswanaBrazilBulgariaBurkina FasoBurundiCabo VerdeCambodiaCanadaCentral African RepublicChileColombiaCongo, Dem. Rep.Congo, Rep.Costa RicaCote d'IvoireCroatiaCyprusCzech RepublicDenmarkDominicaDominican RepublicEgypt, Arab Rep.El SalvadorEquatorial GuineaEstoniaEthiopiaFijiFinlandFranceGambia, TheGeorgiaGermanyGhanaGreeceGrenadaGuatemalaHondurasHong Kong SAR, ChinaHungaryIcelandIndiaIndonesiaIran, Islamic Rep.IraqIrelandIsraelItalyJamaicaJapanJordanKazakhstanKenyaKiribatiKorea, Rep.KuwaitKyrgyz RepublicLao PDRLatviaLebanonLesothoLiberiaLithuaniaLuxembourgMacao SAR, ChinaMacedonia, FYRMadagascarMalawiMalaysiaMaldivesMaliMaltaMauritiusMexicoMicronesia, Fed. Sts.MoldovaMongoliaMoroccoMozambiqueNamibiaNepalNetherlandsNew ZealandNicaraguaNigeriaNorwayOmanPakistanPanamaPapua New GuineaParaguayPeruPhilippinesPolandPortugalQatarRomaniaRussian FederationRwandaSamoaSan MarinoSao Tome and PrincipeSenegalSerbiaSeychellesSierra LeoneSingaporeSlovak RepublicSloveniaSolomon IslandsSouth AfricaSpainSri LankaSt. Kitts and NevisSt. LuciaSurinameSwazilandSwedenSwitzerlandSyrian Arab RepublicTajikistanTanzaniaThailandTimor-LesteTogoTrinidad and TobagoTunisiaTurkeyUgandaUkraineUnited Arab EmiratesUnited KingdomUnited StatesUruguayVanuatuVenezuela, RBWest Bank and GazaYemen, Rep.ZambiaZimbabwe Timeline:
This timeline shows a graph from 2002 to 2013 of Suriname. No data until 2001. Number of actual observations by date: 12.
Source name:
World Development Indicators
Source organization:
International Monetary Fund, Government Finance Statistics Yearbook and data files.
Categories, topics:
Public Sector
Last updated:
apr 23, 2017
Indicators value changes by year
Minimum:
102.154 mln
jan 1, 2004
Maximum:
1.246 bln
jan 1, 2013
At the date of observation
Value
Absolute change
Change from previous value
jan 1, 2002
130.057 mln
+130.057 mln
0.0%
jan 1, 2003
112.92 mln
-17.137 mln
-13.18%
jan 1, 2004
102.154 mln
-10.766 mln
-9.53%
jan 1, 2005
219.344 mln
+117.19 mln
114.72%
jan 1, 2006
304.638 mln
+85.294 mln
38.89%
jan 1, 2007
416.658 mln
+112.02 mln
36.77%
jan 1, 2008
480.766 mln
+64.107 mln
15.39%
jan 1, 2009
488.006 mln
+7.24 mln
1.51%
jan 1, 2010
652.25 mln
+164.244 mln
33.66%
jan 1, 2011
638.699 mln
-13.551 mln
-2.08%
jan 1, 2012
771.969 mln
+133.27 mln
20.87%
jan 1, 2013
1.246 bln
+474.424 mln
61.46%
Ranking of countries by current statistics by years


Comments: