29
/
en
AIzaSyAYiBZKx7MnpbEhh9jyipgxe19OcubqV5w
April 1, 2024
201967
Morocco
MAR
true
2
1
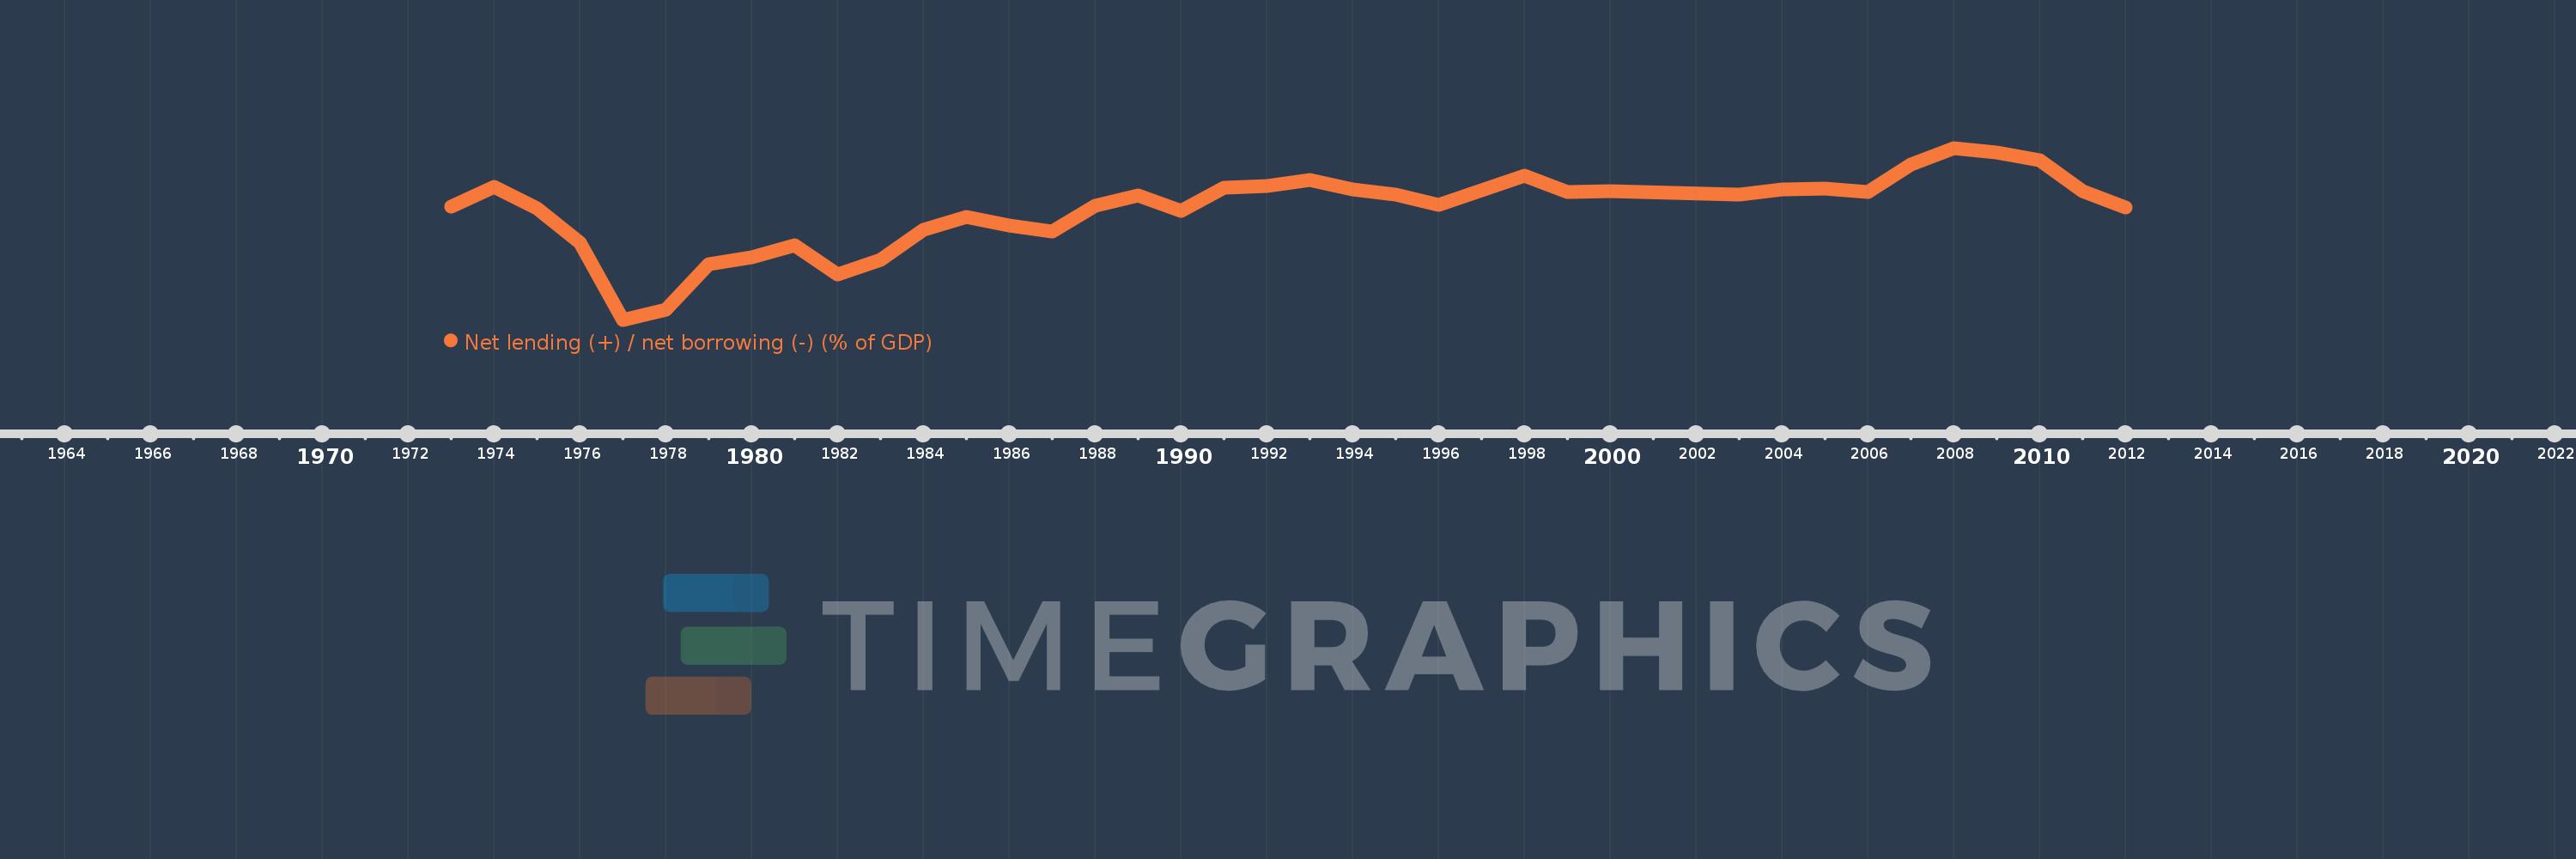
Net lending (+) / net borrowing (-) (% of GDP)
2012,2011,2010,2009,2008,2007,2006,2005,2004,2003,2000,1999,1998,1996,1995,1994,1993,1992,1991,1990,1989,1988,1987,1986,1985,1984,1983,1982,1981,1980,1979,1978,1977,1976,1975,1974,1973
This statistics in other country:
AfghanistanAlbaniaAlgeriaAngolaAntigua and BarbudaArmeniaAustraliaAustriaAzerbaijanBahamas, TheBahrainBangladeshBarbadosBelarusBelgiumBelizeBhutanBoliviaBosnia and HerzegovinaBrazilBurundiCabo VerdeCambodiaCanadaCaribbean small statesCentral African RepublicCentral Europe and the BalticsChileCongo, Dem. Rep.Congo, Rep.Costa RicaCote d'IvoireCroatiaCyprusCzech RepublicDenmarkDominicaDominican RepublicEarly-demographic dividendEgypt, Arab Rep.El SalvadorEquatorial GuineaEstoniaEthiopiaEuro areaEurope & Central AsiaEurope & Central Asia (excluding high income)Europe & Central Asia (IDA & IBRD countries)European UnionFijiFinlandFranceGambia, TheGeorgiaGermanyGreeceGuatemalaHigh incomeHondurasHungaryIcelandIDA blendIndiaIndonesiaIran, Islamic Rep.IraqIrelandIsraelItalyJamaicaKazakhstanKiribatiKorea, Rep.Kyrgyz RepublicLao PDRLatin America & Caribbean Latin America & Caribbean (excluding high income)Latin America & the Caribbean (IDA & IBRD countries)LatviaLebanonLithuaniaLower middle incomeLuxembourgMacao SAR, ChinaMacedonia, FYRMadagascarMalawiMaldivesMaliMaltaMauritiusMexicoMicronesia, Fed. Sts.Middle East & North Africa (excluding high income)Middle East & North Africa (IDA & IBRD countries)MoldovaMongoliaMoroccoMozambiqueNamibiaNepalNetherlandsNew ZealandNicaraguaNigeriaNorth AmericaNorwayOECD membersOmanOther small statesPacific island small statesPakistanParaguayPeruPhilippinesPolandPortugalPost-demographic dividendQatarRomaniaRussian FederationRwandaSamoaSan MarinoSao Tome and PrincipeSenegalSerbiaSierra LeoneSingaporeSlovak RepublicSmall statesSolomon IslandsSouth AfricaSouth AsiaSouth Asia (IDA & IBRD)SpainSri LankaSub-Saharan Africa Sub-Saharan Africa (excluding high income)Sub-Saharan Africa (IDA & IBRD countries)SurinameSwazilandSwedenSwitzerlandSyrian Arab RepublicThailandTimor-LesteTrinidad and TobagoTurkeyUgandaUkraineUnited Arab EmiratesUnited KingdomUnited StatesUruguayVanuatuVietnamWest Bank and GazaWorldYemen, Rep.Zimbabwe Timeline:
This timeline shows a graph from 1973 to 2012 of Morocco. No data until 1972. Number of actual observations by date: 37.
Source name:
World Development Indicators
Source organization:
International Monetary Fund, Government Finance Statistics Yearbook and data files.
Categories, topics:
Public Sector
Last updated:
apr 23, 2017
Indicators value changes by year
Minimum:
-16.276
jan 1, 1977
At the date of observation
Value
Absolute change
Change from previous value
jan 1, 1973
-3.984
-3.984
0.0%
jan 1, 1974
-1.818
+2.166
-54.37%
jan 1, 1975
-4.207
-2.389
131.43%
jan 1, 1976
-7.882
-3.675
87.36%
jan 1, 1977
-16.276
-8.394
106.49%
jan 1, 1978
-15.215
+1.062
-6.52%
jan 1, 1979
-10.226
+4.989
-32.79%
jan 1, 1980
-9.461
+0.765
-7.48%
jan 1, 1981
-8.205
+1.257
-13.28%
jan 1, 1982
-11.396
-3.191
38.9%
jan 1, 1983
-9.792
+1.604
-14.08%
jan 1, 1984
-6.513
+3.279
-33.48%
jan 1, 1985
-5.141
+1.372
-21.06%
jan 1, 1986
-6.047
-0.906
17.63%
jan 1, 1987
-6.698
-0.65
10.76%
jan 1, 1988
-3.888
+2.81
-41.95%
jan 1, 1989
-2.77
+1.118
-28.75%
jan 1, 1990
-4.425
-1.654
59.71%
jan 1, 1991
-1.892
+2.532
-57.23%
jan 1, 1992
-1.766
+0.127
-6.69%
jan 1, 1993
-1.077
+0.688
-38.98%
jan 1, 1994
-2.099
-1.022
94.83%
jan 1, 1995
-2.634
-0.535
25.47%
jan 1, 1996
-3.831
-1.197
45.44%
jan 1, 1998
-0.579
+3.251
-84.87%
jan 1, 1999
-2.378
-1.799
310.49%
jan 1, 2000
-2.27
+0.108
-4.55%
jan 1, 2003
-2.63
-0.36
15.86%
jan 1, 2004
-2.079
+0.552
-20.97%
jan 1, 2005
-2.015
+0.064
-3.09%
jan 1, 2006
-2.345
-0.331
16.42%
jan 1, 2007
0.568
+2.913
-124.22%
jan 1, 2008
2.4
+1.832
322.5%
jan 1, 2009
1.938
-0.461
-19.22%
jan 1, 2010
1.025
-0.913
-47.12%
jan 1, 2011
-2.281
-3.306
-322.52%
jan 1, 2012
-4.065
-1.784
78.2%
Ranking of countries by current statistics by years


Comments: