29
/
en
AIzaSyAYiBZKx7MnpbEhh9jyipgxe19OcubqV5w
April 1, 2024
222587
Peru
PER
true
2
1
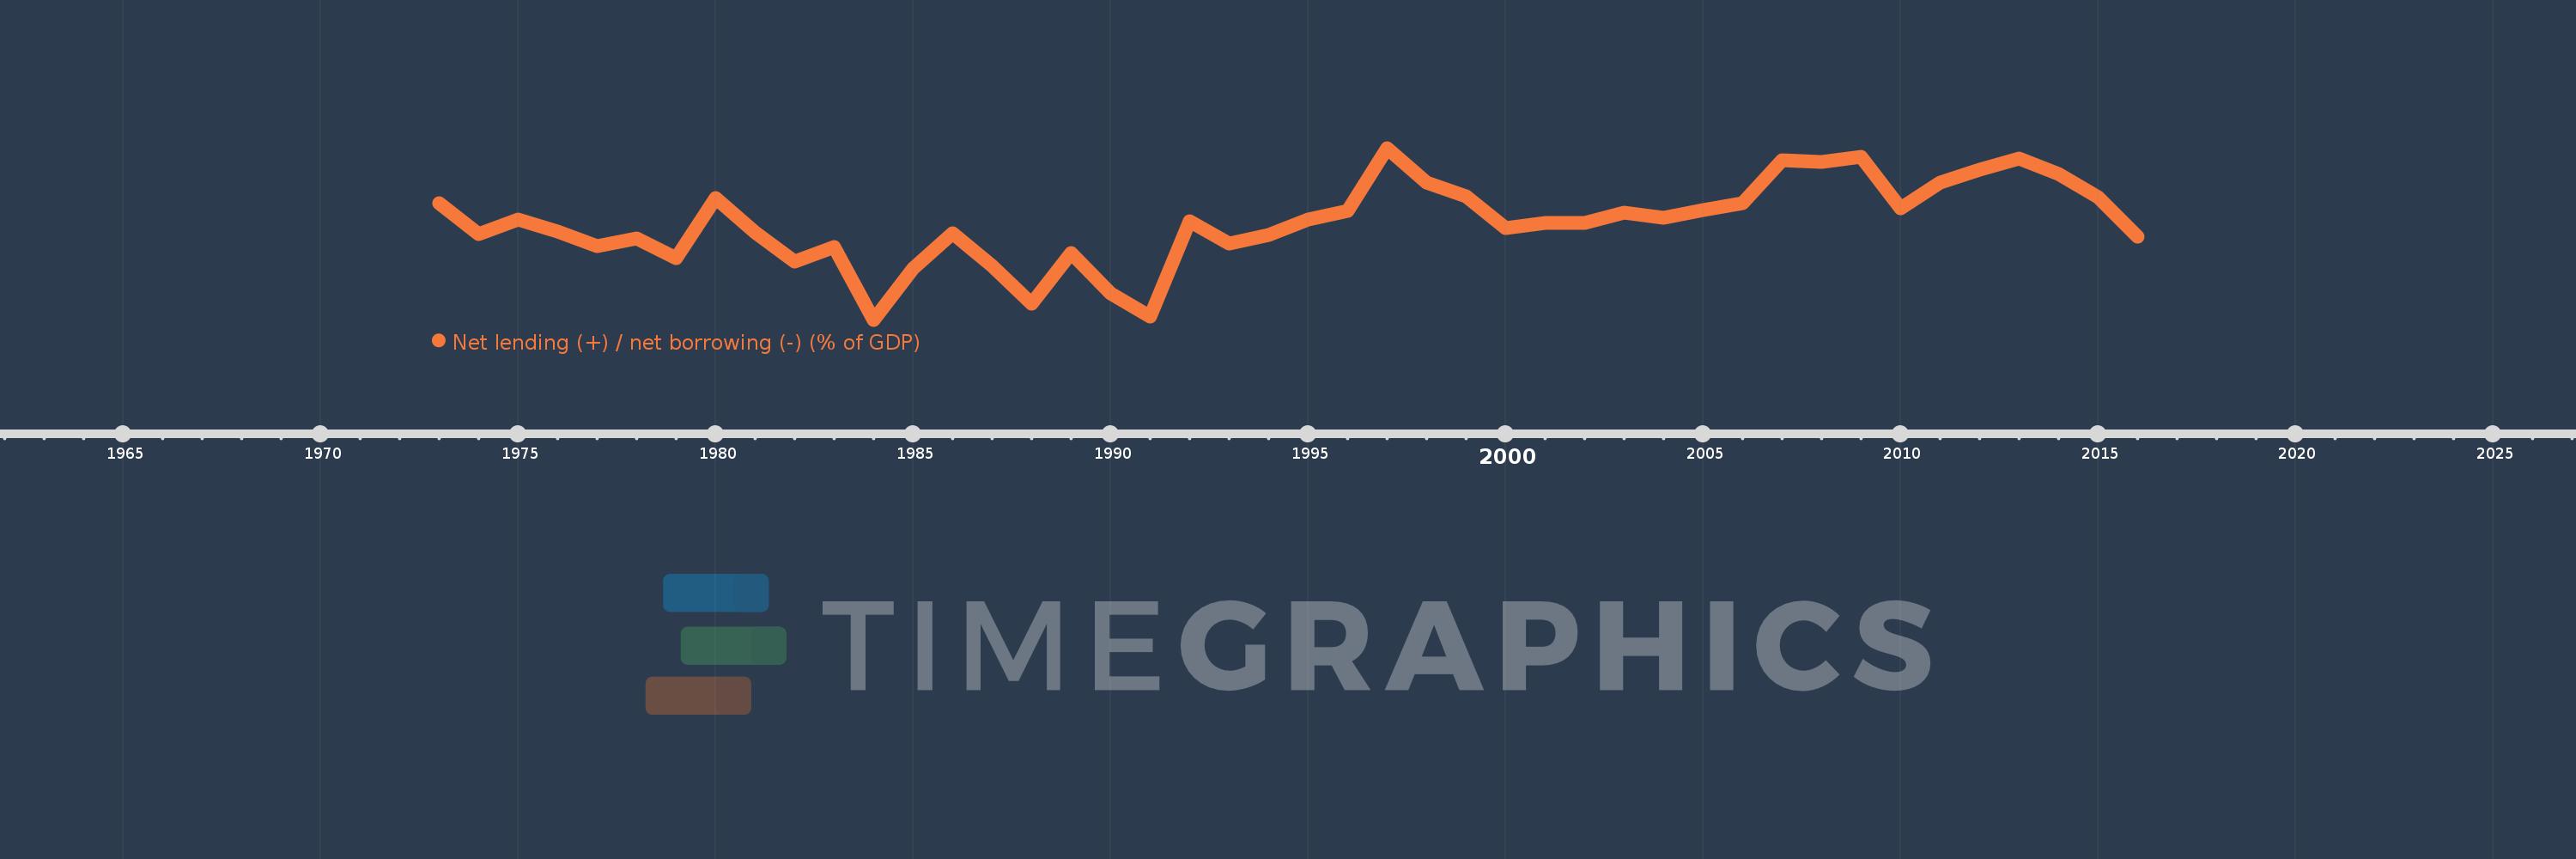
Net lending (+) / net borrowing (-) (% of GDP)
2016,2015,2014,2013,2012,2011,2010,2009,2008,2007,2006,2005,2004,2003,2002,2001,2000,1999,1998,1997,1996,1995,1994,1993,1992,1991,1990,1989,1988,1987,1986,1985,1984,1983,1982,1981,1980,1979,1978,1977,1976,1975,1974,1973
This statistics in other country:
AfghanistanAlbaniaAlgeriaAngolaAntigua and BarbudaArmeniaAustraliaAustriaAzerbaijanBahamas, TheBahrainBangladeshBarbadosBelarusBelgiumBelizeBhutanBoliviaBosnia and HerzegovinaBrazilBurundiCabo VerdeCambodiaCanadaCaribbean small statesCentral African RepublicCentral Europe and the BalticsChileCongo, Dem. Rep.Congo, Rep.Costa RicaCote d'IvoireCroatiaCyprusCzech RepublicDenmarkDominicaDominican RepublicEarly-demographic dividendEgypt, Arab Rep.El SalvadorEquatorial GuineaEstoniaEthiopiaEuro areaEurope & Central AsiaEurope & Central Asia (excluding high income)Europe & Central Asia (IDA & IBRD countries)European UnionFijiFinlandFranceGambia, TheGeorgiaGermanyGreeceGuatemalaHigh incomeHondurasHungaryIcelandIDA blendIndiaIndonesiaIran, Islamic Rep.IraqIrelandIsraelItalyJamaicaKazakhstanKiribatiKorea, Rep.Kyrgyz RepublicLao PDRLatin America & Caribbean Latin America & Caribbean (excluding high income)Latin America & the Caribbean (IDA & IBRD countries)LatviaLebanonLithuaniaLower middle incomeLuxembourgMacao SAR, ChinaMacedonia, FYRMadagascarMalawiMaldivesMaliMaltaMauritiusMexicoMicronesia, Fed. Sts.Middle East & North Africa (excluding high income)Middle East & North Africa (IDA & IBRD countries)MoldovaMongoliaMoroccoMozambiqueNamibiaNepalNetherlandsNew ZealandNicaraguaNigeriaNorth AmericaNorwayOECD membersOmanOther small statesPacific island small statesPakistanParaguayPeruPhilippinesPolandPortugalPost-demographic dividendQatarRomaniaRussian FederationRwandaSamoaSan MarinoSao Tome and PrincipeSenegalSerbiaSierra LeoneSingaporeSlovak RepublicSmall statesSolomon IslandsSouth AfricaSouth AsiaSouth Asia (IDA & IBRD)SpainSri LankaSub-Saharan Africa Sub-Saharan Africa (excluding high income)Sub-Saharan Africa (IDA & IBRD countries)SurinameSwazilandSwedenSwitzerlandSyrian Arab RepublicThailandTimor-LesteTrinidad and TobagoTurkeyUgandaUkraineUnited Arab EmiratesUnited KingdomUnited StatesUruguayVanuatuVietnamWest Bank and GazaWorldYemen, Rep.Zimbabwe Timeline:
This timeline shows a graph from 1973 to 2016 of Peru. No data until 1972. Number of actual observations by date: 44.
Source name:
World Development Indicators
Source organization:
International Monetary Fund, Government Finance Statistics Yearbook and data files.
Categories, topics:
Public Sector
Last updated:
apr 23, 2017
Indicators value changes by year
Minimum:
-8.294
jan 1, 1984
At the date of observation
Value
Absolute change
Change from previous value
jan 1, 1973
-0.844
-0.844
0.0%
jan 1, 1974
-2.82
-1.977
234.33%
jan 1, 1975
-1.865
+0.956
-33.89%
jan 1, 1976
-2.633
-0.769
41.24%
jan 1, 1977
-3.558
-0.924
35.1%
jan 1, 1978
-3.102
+0.456
-12.82%
jan 1, 1979
-4.352
-1.251
40.32%
jan 1, 1980
-0.53
+3.822
-87.82%
jan 1, 1981
-2.71
-2.181
411.45%
jan 1, 1982
-4.594
-1.883
69.49%
jan 1, 1983
-3.664
+0.93
-20.25%
jan 1, 1984
-8.294
-4.63
126.38%
jan 1, 1985
-5.021
+3.273
-39.46%
jan 1, 1986
-2.757
+2.264
-45.09%
jan 1, 1987
-4.833
-2.075
75.27%
jan 1, 1988
-7.244
-2.411
49.89%
jan 1, 1989
-4.016
+3.228
-44.56%
jan 1, 1990
-6.585
-2.569
63.98%
jan 1, 1991
-8.075
-1.49
22.63%
jan 1, 1992
-2.016
+6.059
-75.03%
jan 1, 1993
-3.439
-1.423
70.57%
jan 1, 1994
-2.889
+0.55
-16.0%
jan 1, 1995
-1.899
+0.99
-34.27%
jan 1, 1996
-1.321
+0.578
-30.46%
jan 1, 1997
2.699
+4.019
-304.38%
jan 1, 1998
0.489
-2.21
-81.87%
jan 1, 1999
-0.383
-0.872
-178.24%
jan 1, 2000
-2.408
-2.025
529.14%
jan 1, 2001
-2.117
+0.292
-12.11%
jan 1, 2002
-2.125
-0.009
0.42%
jan 1, 2003
-1.448
+0.678
-31.88%
jan 1, 2004
-1.75
-0.302
20.89%
jan 1, 2005
-1.252
+0.498
-28.48%
jan 1, 2006
-0.861
+0.391
-31.26%
jan 1, 2007
1.902
+2.763
-321.07%
jan 1, 2008
1.792
-0.111
-5.82%
jan 1, 2009
2.134
+0.342
19.11%
jan 1, 2010
-1.143
-3.277
-153.58%
jan 1, 2011
0.504
+1.647
-144.1%
jan 1, 2012
1.309
+0.805
159.67%
jan 1, 2013
2.044
+0.735
56.12%
jan 1, 2014
1.055
-0.989
-48.4%
jan 1, 2015
-0.437
-1.492
-141.46%
jan 1, 2016
-2.998
-2.561
585.67%
Ranking of countries by current statistics by years


Comments: