29
/
en
AIzaSyAYiBZKx7MnpbEhh9jyipgxe19OcubqV5w
April 1, 2024
191724
Malta
MLT
true
2
1
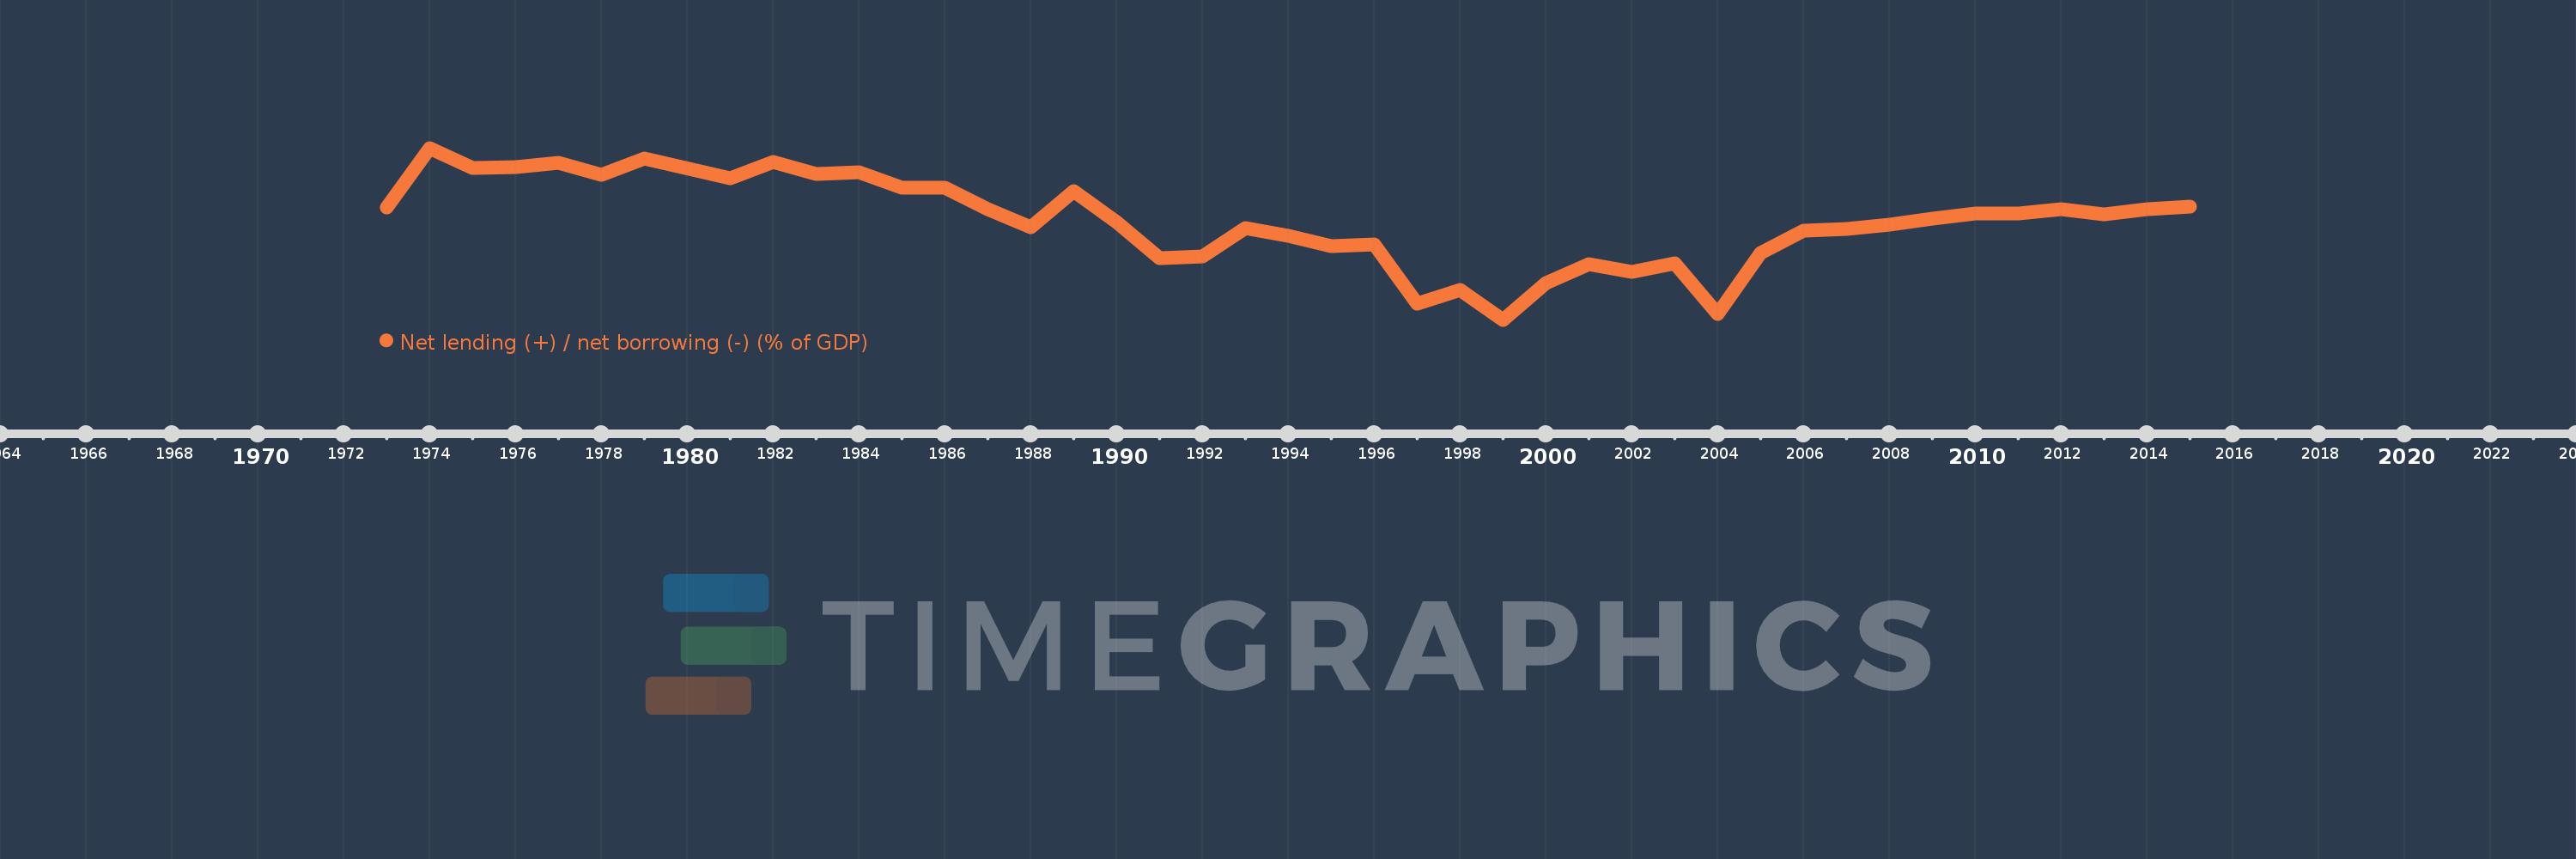
Net lending (+) / net borrowing (-) (% of GDP)
2015,2014,2013,2012,2011,2010,2009,2008,2007,2006,2005,2004,2003,2002,2001,2000,1999,1998,1997,1996,1995,1994,1993,1992,1991,1990,1989,1988,1987,1986,1985,1984,1983,1982,1981,1979,1978,1977,1976,1975,1974,1973
This statistics in other country:
AfghanistanAlbaniaAlgeriaAngolaAntigua and BarbudaArmeniaAustraliaAustriaAzerbaijanBahamas, TheBahrainBangladeshBarbadosBelarusBelgiumBelizeBhutanBoliviaBosnia and HerzegovinaBrazilBurundiCabo VerdeCambodiaCanadaCaribbean small statesCentral African RepublicCentral Europe and the BalticsChileCongo, Dem. Rep.Congo, Rep.Costa RicaCote d'IvoireCroatiaCyprusCzech RepublicDenmarkDominicaDominican RepublicEarly-demographic dividendEgypt, Arab Rep.El SalvadorEquatorial GuineaEstoniaEthiopiaEuro areaEurope & Central AsiaEurope & Central Asia (excluding high income)Europe & Central Asia (IDA & IBRD countries)European UnionFijiFinlandFranceGambia, TheGeorgiaGermanyGreeceGuatemalaHigh incomeHondurasHungaryIcelandIDA blendIndiaIndonesiaIran, Islamic Rep.IraqIrelandIsraelItalyJamaicaKazakhstanKiribatiKorea, Rep.Kyrgyz RepublicLao PDRLatin America & Caribbean Latin America & Caribbean (excluding high income)Latin America & the Caribbean (IDA & IBRD countries)LatviaLebanonLithuaniaLower middle incomeLuxembourgMacao SAR, ChinaMacedonia, FYRMadagascarMalawiMaldivesMaliMaltaMauritiusMexicoMicronesia, Fed. Sts.Middle East & North Africa (excluding high income)Middle East & North Africa (IDA & IBRD countries)MoldovaMongoliaMoroccoMozambiqueNamibiaNepalNetherlandsNew ZealandNicaraguaNigeriaNorth AmericaNorwayOECD membersOmanOther small statesPacific island small statesPakistanParaguayPeruPhilippinesPolandPortugalPost-demographic dividendQatarRomaniaRussian FederationRwandaSamoaSan MarinoSao Tome and PrincipeSenegalSerbiaSierra LeoneSingaporeSlovak RepublicSmall statesSolomon IslandsSouth AfricaSouth AsiaSouth Asia (IDA & IBRD)SpainSri LankaSub-Saharan Africa Sub-Saharan Africa (excluding high income)Sub-Saharan Africa (IDA & IBRD countries)SurinameSwazilandSwedenSwitzerlandSyrian Arab RepublicThailandTimor-LesteTrinidad and TobagoTurkeyUgandaUkraineUnited Arab EmiratesUnited KingdomUnited StatesUruguayVanuatuVietnamWest Bank and GazaWorldYemen, Rep.Zimbabwe Timeline:
This timeline shows a graph from 1973 to 2015 of Malta. No data until 1972. Number of actual observations by date: 42.
Source name:
World Development Indicators
Source organization:
International Monetary Fund, Government Finance Statistics Yearbook and data files.
Categories, topics:
Public Sector
Last updated:
apr 23, 2017
Indicators value changes by year
Minimum:
-21.938
jan 1, 1999
At the date of observation
Value
Absolute change
Change from previous value
jan 1, 1973
-2.282
-2.282
0.0%
jan 1, 1974
8.167
+10.449
-457.85%
jan 1, 1975
4.608
-3.559
-43.58%
jan 1, 1976
4.862
+0.255
5.53%
jan 1, 1977
5.632
+0.769
15.82%
jan 1, 1978
3.505
-2.127
-37.76%
jan 1, 1979
6.245
+2.739
78.15%
jan 1, 1981
2.797
-3.447
-55.2%
jan 1, 1982
5.742
+2.944
105.26%
jan 1, 1983
3.609
-2.133
-37.15%
jan 1, 1984
3.838
+0.23
6.37%
jan 1, 1985
1.256
-2.582
-67.28%
jan 1, 1986
1.199
-0.057
-4.5%
jan 1, 1987
-2.504
-3.703
-308.74%
jan 1, 1988
-5.758
-3.254
129.98%
jan 1, 1989
0.632
+6.39
-110.97%
jan 1, 1990
-4.803
-5.434
-860.43%
jan 1, 1991
-11.216
-6.414
133.54%
jan 1, 1992
-10.795
+0.421
-3.75%
jan 1, 1993
-5.919
+4.876
-45.17%
jan 1, 1994
-7.253
-1.334
22.54%
jan 1, 1995
-9.077
-1.824
25.15%
jan 1, 1996
-8.784
+0.293
-3.23%
jan 1, 1997
-19.075
-10.291
117.16%
jan 1, 1998
-16.725
+2.35
-12.32%
jan 1, 1999
-21.938
-5.214
31.17%
jan 1, 2000
-15.461
+6.477
-29.53%
jan 1, 2001
-12.198
+3.263
-21.1%
jan 1, 2002
-13.482
-1.284
10.53%
jan 1, 2003
-12.016
+1.466
-10.88%
jan 1, 2004
-20.968
-8.952
74.5%
jan 1, 2005
-10.206
+10.762
-51.32%
jan 1, 2006
-6.344
+3.863
-37.84%
jan 1, 2007
-6.088
+0.256
-4.03%
jan 1, 2008
-5.241
+0.847
-13.91%
jan 1, 2009
-4.169
+1.072
-20.45%
jan 1, 2010
-3.298
+0.871
-20.89%
jan 1, 2011
-3.251
+0.046
-1.41%
jan 1, 2012
-2.574
+0.677
-20.83%
jan 1, 2013
-3.542
-0.968
37.62%
jan 1, 2014
-2.559
+0.984
-27.77%
jan 1, 2015
-2.102
+0.457
-17.86%
Ranking of countries by current statistics by years


Comments: