29
/
en
AIzaSyAYiBZKx7MnpbEhh9jyipgxe19OcubqV5w
April 1, 2024
117227
Cyprus
CYP
true
2
1
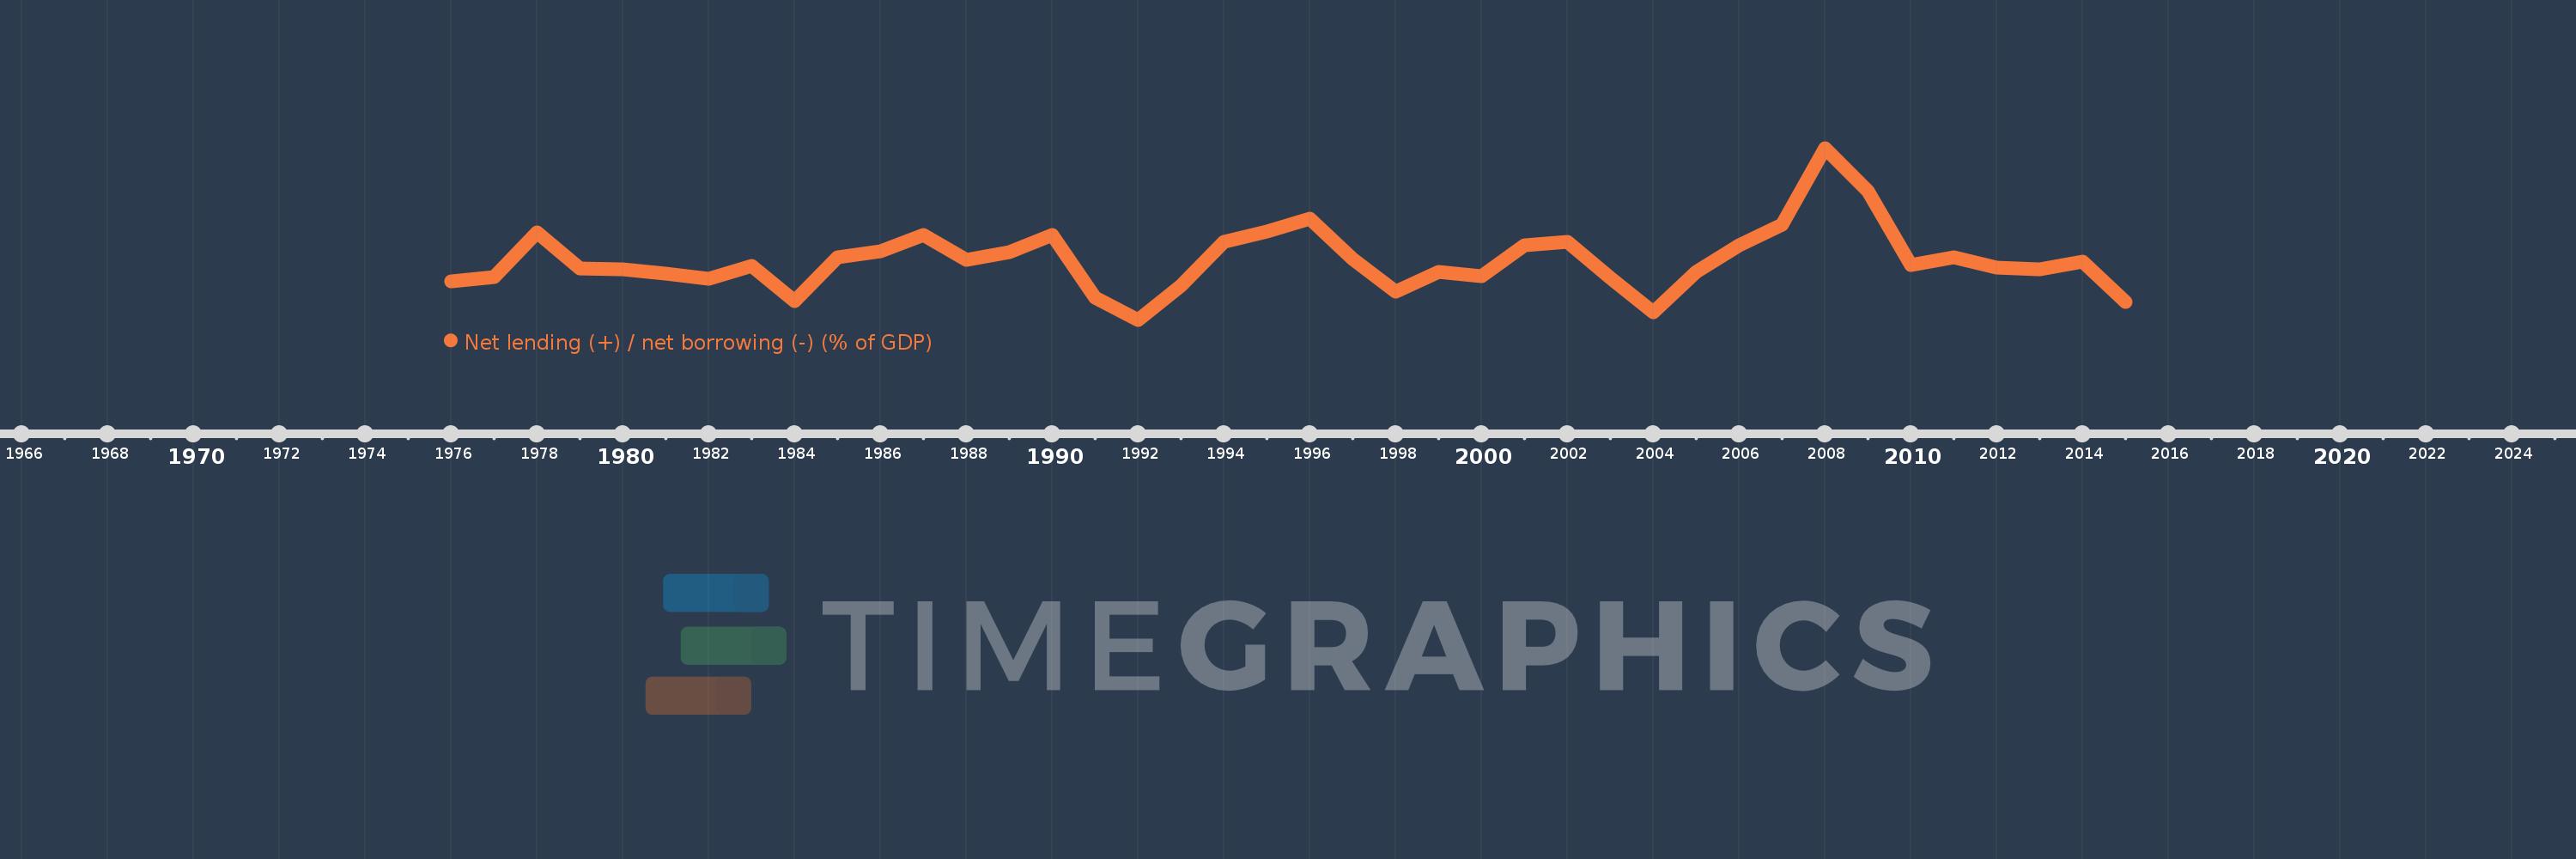
Net lending (+) / net borrowing (-) (% of GDP)
2015,2014,2013,2012,2011,2010,2009,2008,2007,2006,2005,2004,2003,2002,2001,2000,1999,1998,1997,1996,1995,1994,1993,1992,1991,1990,1989,1988,1987,1986,1985,1984,1983,1982,1981,1980,1979,1978,1977,1976
This statistics in other country:
AfghanistanAlbaniaAlgeriaAngolaAntigua and BarbudaArmeniaAustraliaAustriaAzerbaijanBahamas, TheBahrainBangladeshBarbadosBelarusBelgiumBelizeBhutanBoliviaBosnia and HerzegovinaBrazilBurundiCabo VerdeCambodiaCanadaCaribbean small statesCentral African RepublicCentral Europe and the BalticsChileCongo, Dem. Rep.Congo, Rep.Costa RicaCote d'IvoireCroatiaCyprusCzech RepublicDenmarkDominicaDominican RepublicEarly-demographic dividendEgypt, Arab Rep.El SalvadorEquatorial GuineaEstoniaEthiopiaEuro areaEurope & Central AsiaEurope & Central Asia (excluding high income)Europe & Central Asia (IDA & IBRD countries)European UnionFijiFinlandFranceGambia, TheGeorgiaGermanyGreeceGuatemalaHigh incomeHondurasHungaryIcelandIDA blendIndiaIndonesiaIran, Islamic Rep.IraqIrelandIsraelItalyJamaicaKazakhstanKiribatiKorea, Rep.Kyrgyz RepublicLao PDRLatin America & Caribbean Latin America & Caribbean (excluding high income)Latin America & the Caribbean (IDA & IBRD countries)LatviaLebanonLithuaniaLower middle incomeLuxembourgMacao SAR, ChinaMacedonia, FYRMadagascarMalawiMaldivesMaliMaltaMauritiusMexicoMicronesia, Fed. Sts.Middle East & North Africa (excluding high income)Middle East & North Africa (IDA & IBRD countries)MoldovaMongoliaMoroccoMozambiqueNamibiaNepalNetherlandsNew ZealandNicaraguaNigeriaNorth AmericaNorwayOECD membersOmanOther small statesPacific island small statesPakistanParaguayPeruPhilippinesPolandPortugalPost-demographic dividendQatarRomaniaRussian FederationRwandaSamoaSan MarinoSao Tome and PrincipeSenegalSerbiaSierra LeoneSingaporeSlovak RepublicSmall statesSolomon IslandsSouth AfricaSouth AsiaSouth Asia (IDA & IBRD)SpainSri LankaSub-Saharan Africa Sub-Saharan Africa (excluding high income)Sub-Saharan Africa (IDA & IBRD countries)SurinameSwazilandSwedenSwitzerlandSyrian Arab RepublicThailandTimor-LesteTrinidad and TobagoTurkeyUgandaUkraineUnited Arab EmiratesUnited KingdomUnited StatesUruguayVanuatuVietnamWest Bank and GazaWorldYemen, Rep.Zimbabwe Timeline:
This timeline shows a graph from 1976 to 2015 of Cyprus. No data until 1975. Number of actual observations by date: 40.
Source name:
World Development Indicators
Source organization:
International Monetary Fund, Government Finance Statistics Yearbook and data files.
Categories, topics:
Public Sector
Last updated:
apr 23, 2017
Indicators value changes by year
Minimum:
-10.496
jan 1, 1992
At the date of observation
Value
Absolute change
Change from previous value
jan 1, 1976
-6.883
-6.883
0.0%
jan 1, 1977
-6.475
+0.408
-5.93%
jan 1, 1978
-2.295
+4.18
-64.56%
jan 1, 1979
-5.672
-3.377
147.16%
jan 1, 1980
-5.761
-0.088
1.56%
jan 1, 1981
-6.177
-0.416
7.22%
jan 1, 1982
-6.691
-0.514
8.32%
jan 1, 1983
-5.443
+1.247
-18.64%
jan 1, 1984
-8.773
-3.329
61.16%
jan 1, 1985
-4.65
+4.123
-46.99%
jan 1, 1986
-4.078
+0.572
-12.31%
jan 1, 1987
-2.579
+1.499
-36.76%
jan 1, 1988
-4.93
-2.351
91.18%
jan 1, 1989
-4.179
+0.751
-15.23%
jan 1, 1990
-2.597
+1.582
-37.85%
jan 1, 1991
-8.416
-5.818
224.01%
jan 1, 1992
-10.496
-2.08
24.71%
jan 1, 1993
-7.282
+3.214
-30.62%
jan 1, 1994
-3.243
+4.039
-55.47%
jan 1, 1995
-2.239
+1.004
-30.97%
jan 1, 1996
-1.062
+1.177
-52.57%
jan 1, 1997
-4.814
-3.752
353.43%
jan 1, 1998
-7.905
-3.091
64.21%
jan 1, 1999
-6.06
+1.846
-23.35%
jan 1, 2000
-6.442
-0.383
6.31%
jan 1, 2001
-3.526
+2.916
-45.26%
jan 1, 2002
-3.235
+0.291
-8.26%
jan 1, 2003
-6.609
-3.374
104.29%
jan 1, 2004
-9.804
-3.195
48.34%
jan 1, 2005
-6.03
+3.774
-38.5%
jan 1, 2006
-3.504
+2.526
-41.9%
jan 1, 2007
-1.611
+1.893
-54.03%
jan 1, 2008
5.562
+7.172
-445.34%
jan 1, 2009
1.557
-4.005
-72.0%
jan 1, 2010
-5.382
-6.939
-445.65%
jan 1, 2011
-4.685
+0.697
-12.96%
jan 1, 2012
-5.619
-0.934
19.94%
jan 1, 2013
-5.801
-0.182
3.24%
jan 1, 2014
-5.052
+0.749
-12.91%
jan 1, 2015
-8.818
-3.766
74.55%
Ranking of countries by current statistics by years


Comments: