29
/
en
AIzaSyAYiBZKx7MnpbEhh9jyipgxe19OcubqV5w
April 1, 2024
33705
European Union
EUU
false
2
1
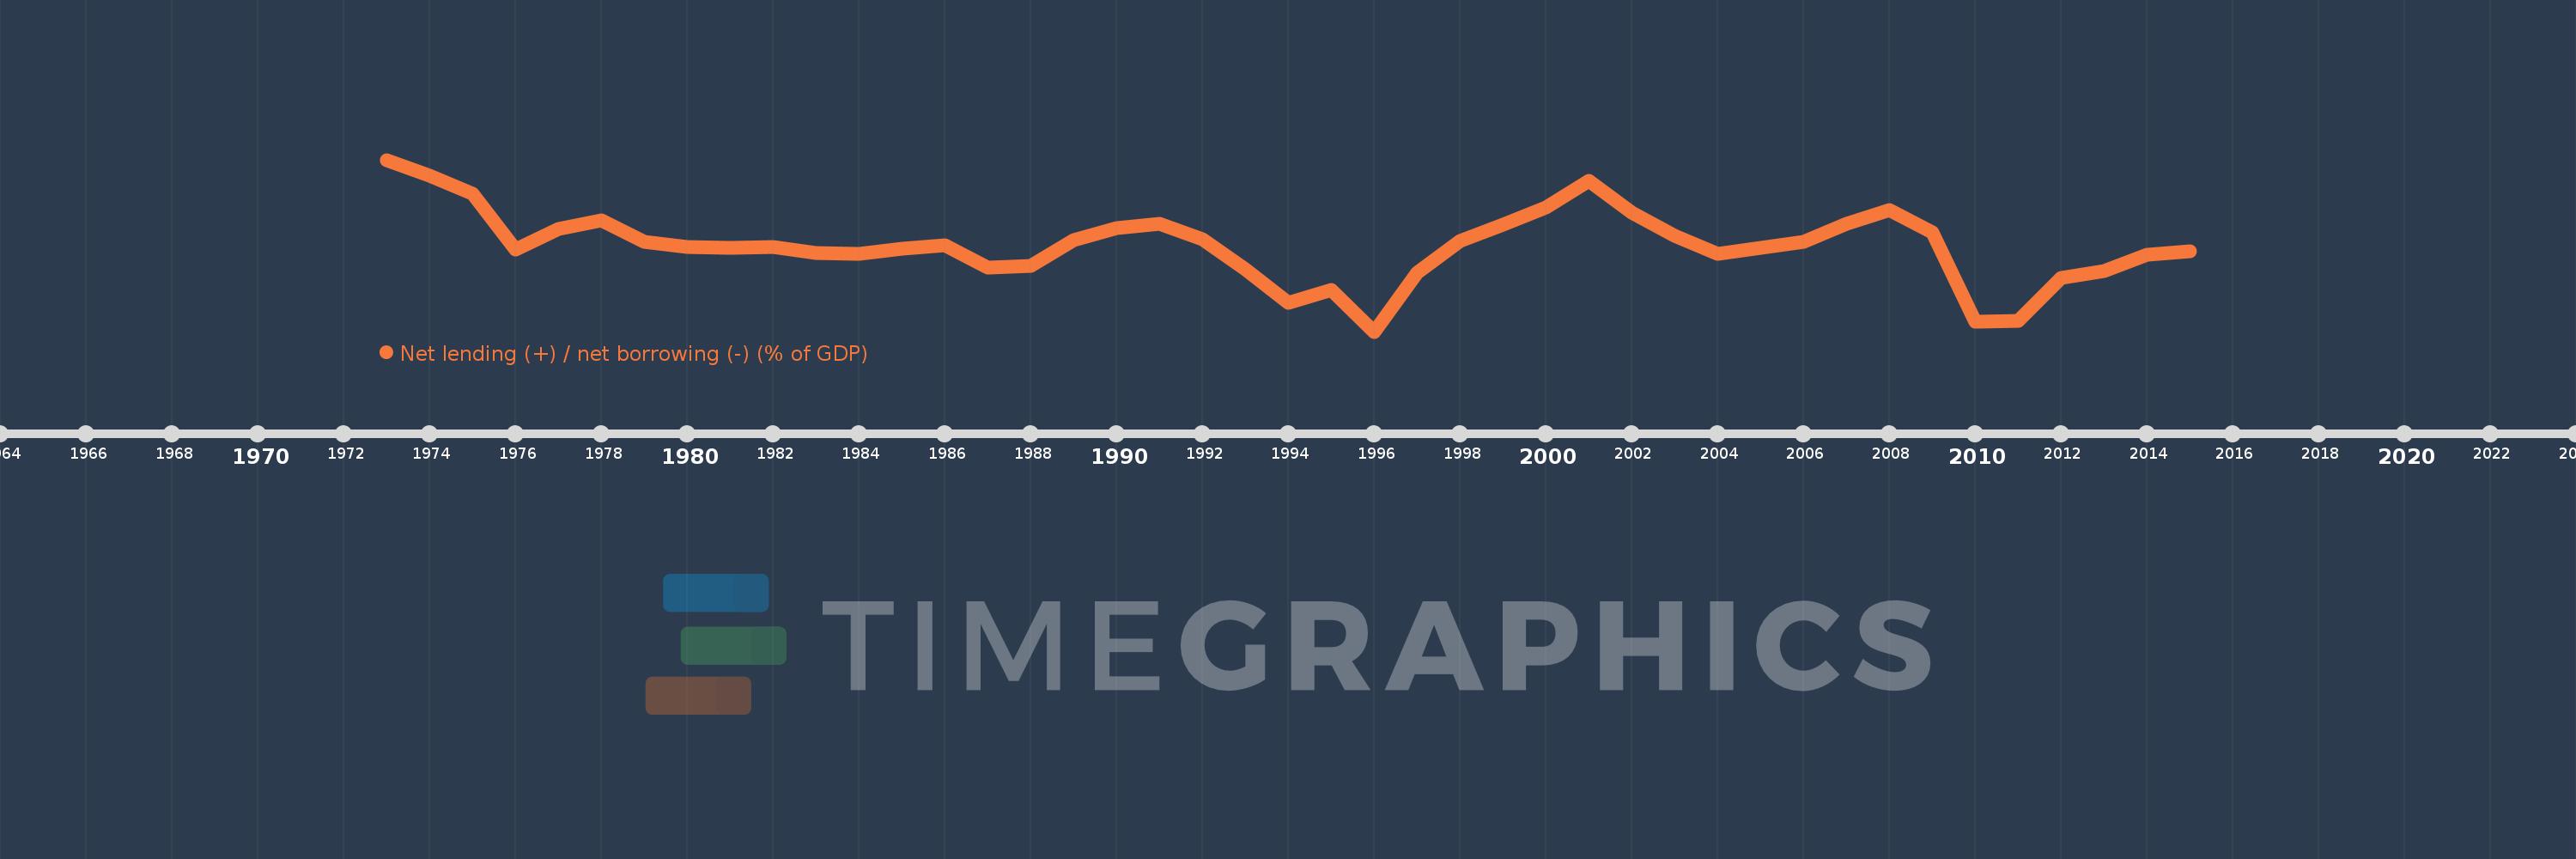
Net lending (+) / net borrowing (-) (% of GDP)
2015,2014,2013,2012,2011,2010,2009,2008,2007,2006,2005,2004,2003,2002,2001,2000,1999,1998,1997,1996,1995,1994,1993,1992,1991,1990,1989,1988,1987,1986,1985,1984,1983,1982,1981,1980,1979,1978,1977,1976,1975,1974,1973
This statistics in other country:
AfghanistanAlbaniaAlgeriaAngolaAntigua and BarbudaArmeniaAustraliaAustriaAzerbaijanBahamas, TheBahrainBangladeshBarbadosBelarusBelgiumBelizeBhutanBoliviaBosnia and HerzegovinaBrazilBurundiCabo VerdeCambodiaCanadaCaribbean small statesCentral African RepublicCentral Europe and the BalticsChileCongo, Dem. Rep.Congo, Rep.Costa RicaCote d'IvoireCroatiaCyprusCzech RepublicDenmarkDominicaDominican RepublicEarly-demographic dividendEgypt, Arab Rep.El SalvadorEquatorial GuineaEstoniaEthiopiaEuro areaEurope & Central AsiaEurope & Central Asia (excluding high income)Europe & Central Asia (IDA & IBRD countries)European UnionFijiFinlandFranceGambia, TheGeorgiaGermanyGreeceGuatemalaHigh incomeHondurasHungaryIcelandIDA blendIndiaIndonesiaIran, Islamic Rep.IraqIrelandIsraelItalyJamaicaKazakhstanKiribatiKorea, Rep.Kyrgyz RepublicLao PDRLatin America & Caribbean Latin America & Caribbean (excluding high income)Latin America & the Caribbean (IDA & IBRD countries)LatviaLebanonLithuaniaLower middle incomeLuxembourgMacao SAR, ChinaMacedonia, FYRMadagascarMalawiMaldivesMaliMaltaMauritiusMexicoMicronesia, Fed. Sts.Middle East & North Africa (excluding high income)Middle East & North Africa (IDA & IBRD countries)MoldovaMongoliaMoroccoMozambiqueNamibiaNepalNetherlandsNew ZealandNicaraguaNigeriaNorth AmericaNorwayOECD membersOmanOther small statesPacific island small statesPakistanParaguayPeruPhilippinesPolandPortugalPost-demographic dividendQatarRomaniaRussian FederationRwandaSamoaSan MarinoSao Tome and PrincipeSenegalSerbiaSierra LeoneSingaporeSlovak RepublicSmall statesSolomon IslandsSouth AfricaSouth AsiaSouth Asia (IDA & IBRD)SpainSri LankaSub-Saharan Africa Sub-Saharan Africa (excluding high income)Sub-Saharan Africa (IDA & IBRD countries)SurinameSwazilandSwedenSwitzerlandSyrian Arab RepublicThailandTimor-LesteTrinidad and TobagoTurkeyUgandaUkraineUnited Arab EmiratesUnited KingdomUnited StatesUruguayVanuatuVietnamWest Bank and GazaWorldYemen, Rep.Zimbabwe Timeline:
This timeline shows a graph from 1973 to 2015 of European Union. No data until 1972. Number of actual observations by date: 43.
Source name:
World Development Indicators
Source organization:
International Monetary Fund, Government Finance Statistics Yearbook and data files.
Categories, topics:
Public Sector
Last updated:
apr 23, 2017
Indicators value changes by year
Minimum:
-6.009
jan 1, 1996
At the date of observation
Value
Absolute change
Change from previous value
jan 1, 1973
0.969
+0.969
0.0%
jan 1, 1974
0.323
-0.646
-66.65%
jan 1, 1975
-0.397
-0.72
-222.81%
jan 1, 1976
-2.688
-2.291
577.41%
jan 1, 1977
-1.842
+0.846
-31.47%
jan 1, 1978
-1.507
+0.335
-18.2%
jan 1, 1979
-2.355
-0.848
56.31%
jan 1, 1980
-2.589
-0.233
9.9%
jan 1, 1981
-2.609
-0.021
0.8%
jan 1, 1982
-2.588
+0.021
-0.81%
jan 1, 1983
-2.811
-0.223
8.63%
jan 1, 1984
-2.841
-0.029
1.04%
jan 1, 1985
-2.648
+0.193
-6.8%
jan 1, 1986
-2.5
+0.147
-5.56%
jan 1, 1987
-3.421
-0.92
36.81%
jan 1, 1988
-3.336
+0.085
-2.48%
jan 1, 1989
-2.284
+1.052
-31.53%
jan 1, 1990
-1.814
+0.47
-20.57%
jan 1, 1991
-1.644
+0.17
-9.37%
jan 1, 1992
-2.253
-0.61
37.09%
jan 1, 1993
-3.467
-1.213
53.83%
jan 1, 1994
-4.853
-1.386
39.99%
jan 1, 1995
-4.305
+0.548
-11.3%
jan 1, 1996
-6.009
-1.704
39.59%
jan 1, 1997
-3.62
+2.389
-39.76%
jan 1, 1998
-2.341
+1.278
-35.32%
jan 1, 1999
-1.675
+0.666
-28.44%
jan 1, 2000
-0.951
+0.724
-43.23%
jan 1, 2001
0.122
+1.073
-112.81%
jan 1, 2002
-1.182
-1.304
-1.07K%
jan 1, 2003
-2.13
-0.948
80.17%
jan 1, 2004
-2.858
-0.727
34.15%
jan 1, 2005
-2.599
+0.259
-9.07%
jan 1, 2006
-2.366
+0.233
-8.95%
jan 1, 2007
-1.62
+0.746
-31.53%
jan 1, 2008
-1.07
+0.55
-33.94%
jan 1, 2009
-1.976
-0.906
84.63%
jan 1, 2010
-5.596
-3.621
183.25%
jan 1, 2011
-5.574
+0.023
-0.4%
jan 1, 2012
-3.838
+1.736
-31.14%
jan 1, 2013
-3.532
+0.306
-7.98%
jan 1, 2014
-2.873
+0.658
-18.64%
jan 1, 2015
-2.731
+0.143
-4.96%
Ranking of countries by current statistics by years


Comments: