29
/
en
AIzaSyAYiBZKx7MnpbEhh9jyipgxe19OcubqV5w
April 1, 2024
133454
Finland
FIN
true
2
1
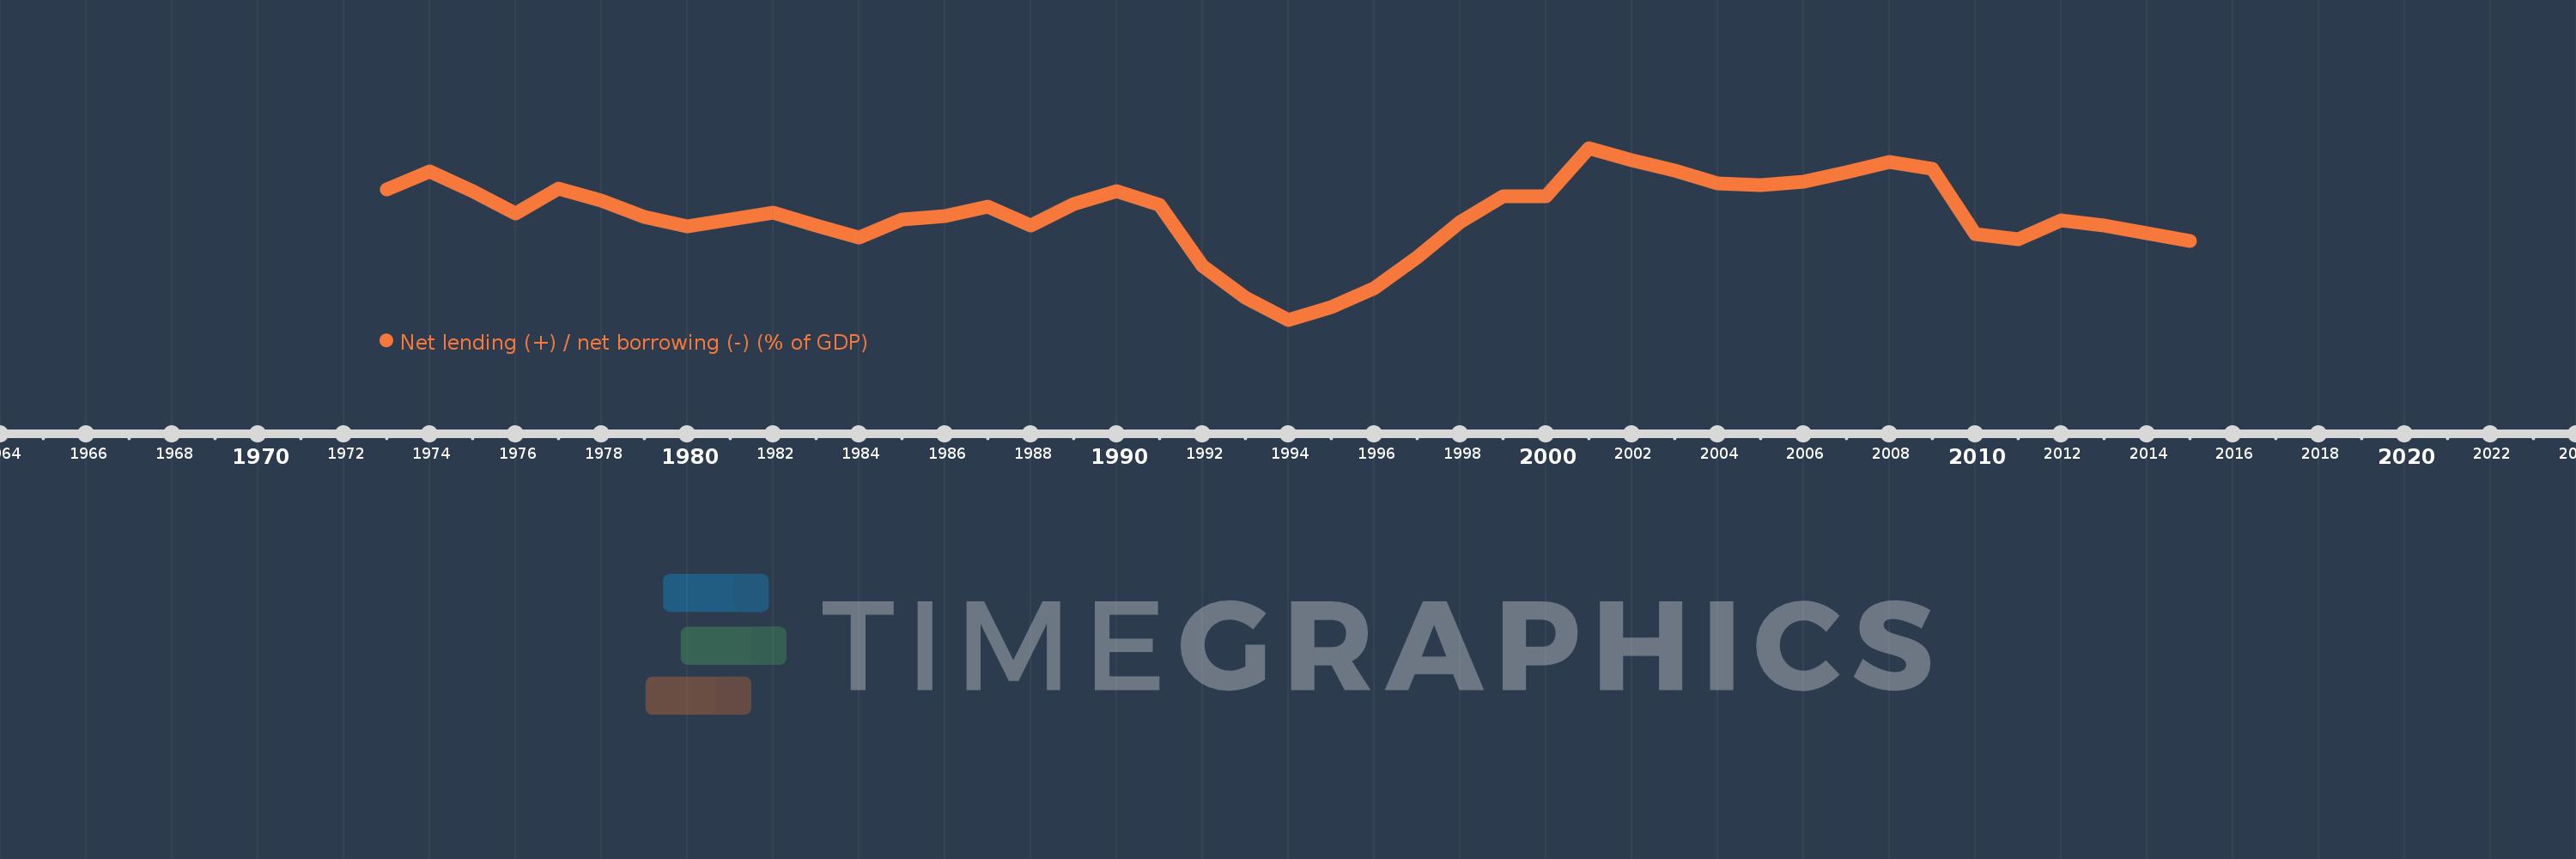
Net lending (+) / net borrowing (-) (% of GDP)
2015,2014,2013,2012,2011,2010,2009,2008,2007,2006,2005,2004,2003,2002,2001,2000,1999,1998,1997,1996,1995,1994,1993,1992,1991,1990,1989,1988,1987,1986,1985,1984,1983,1982,1981,1980,1979,1978,1977,1976,1975,1974,1973
This statistics in other country:
AfghanistanAlbaniaAlgeriaAngolaAntigua and BarbudaArmeniaAustraliaAustriaAzerbaijanBahamas, TheBahrainBangladeshBarbadosBelarusBelgiumBelizeBhutanBoliviaBosnia and HerzegovinaBrazilBurundiCabo VerdeCambodiaCanadaCaribbean small statesCentral African RepublicCentral Europe and the BalticsChileCongo, Dem. Rep.Congo, Rep.Costa RicaCote d'IvoireCroatiaCyprusCzech RepublicDenmarkDominicaDominican RepublicEarly-demographic dividendEgypt, Arab Rep.El SalvadorEquatorial GuineaEstoniaEthiopiaEuro areaEurope & Central AsiaEurope & Central Asia (excluding high income)Europe & Central Asia (IDA & IBRD countries)European UnionFijiFinlandFranceGambia, TheGeorgiaGermanyGreeceGuatemalaHigh incomeHondurasHungaryIcelandIDA blendIndiaIndonesiaIran, Islamic Rep.IraqIrelandIsraelItalyJamaicaKazakhstanKiribatiKorea, Rep.Kyrgyz RepublicLao PDRLatin America & Caribbean Latin America & Caribbean (excluding high income)Latin America & the Caribbean (IDA & IBRD countries)LatviaLebanonLithuaniaLower middle incomeLuxembourgMacao SAR, ChinaMacedonia, FYRMadagascarMalawiMaldivesMaliMaltaMauritiusMexicoMicronesia, Fed. Sts.Middle East & North Africa (excluding high income)Middle East & North Africa (IDA & IBRD countries)MoldovaMongoliaMoroccoMozambiqueNamibiaNepalNetherlandsNew ZealandNicaraguaNigeriaNorth AmericaNorwayOECD membersOmanOther small statesPacific island small statesPakistanParaguayPeruPhilippinesPolandPortugalPost-demographic dividendQatarRomaniaRussian FederationRwandaSamoaSan MarinoSao Tome and PrincipeSenegalSerbiaSierra LeoneSingaporeSlovak RepublicSmall statesSolomon IslandsSouth AfricaSouth AsiaSouth Asia (IDA & IBRD)SpainSri LankaSub-Saharan Africa Sub-Saharan Africa (excluding high income)Sub-Saharan Africa (IDA & IBRD countries)SurinameSwazilandSwedenSwitzerlandSyrian Arab RepublicThailandTimor-LesteTrinidad and TobagoTurkeyUgandaUkraineUnited Arab EmiratesUnited KingdomUnited StatesUruguayVanuatuVietnamWest Bank and GazaWorldYemen, Rep.Zimbabwe Timeline:
This timeline shows a graph from 1973 to 2015 of Finland. No data until 1972. Number of actual observations by date: 43.
Source name:
World Development Indicators
Source organization:
International Monetary Fund, Government Finance Statistics Yearbook and data files.
Categories, topics:
Public Sector
Last updated:
apr 23, 2017
Indicators value changes by year
Minimum:
-10.355
jan 1, 1994
At the date of observation
Value
Absolute change
Change from previous value
jan 1, 1973
2.57
+2.57
0.0%
jan 1, 1974
4.355
+1.786
69.49%
jan 1, 1975
2.383
-1.972
-45.29%
jan 1, 1976
0.166
-2.217
-93.04%
jan 1, 1977
2.644
+2.478
1.49K%
jan 1, 1978
1.445
-1.199
-45.34%
jan 1, 1979
-0.143
-1.588
-109.91%
jan 1, 1980
-1.086
-0.943
658.02%
jan 1, 1981
-0.448
+0.637
-58.7%
jan 1, 1982
0.292
+0.741
-165.18%
jan 1, 1983
-1.021
-1.313
-449.18%
jan 1, 1984
-2.233
-1.212
118.8%
jan 1, 1985
-0.405
+1.828
-81.87%
jan 1, 1986
-0.117
+0.288
-71.14%
jan 1, 1987
0.808
+0.925
-791.12%
jan 1, 1988
-1.04
-1.848
-228.78%
jan 1, 1989
1.147
+2.187
-210.29%
jan 1, 1990
2.341
+1.194
104.1%
jan 1, 1991
1.004
-1.337
-57.1%
jan 1, 1992
-5.011
-6.016
-598.94%
jan 1, 1993
-8.168
-3.156
62.98%
jan 1, 1994
-10.355
-2.187
26.78%
jan 1, 1995
-9.134
+1.221
-11.79%
jan 1, 1996
-7.253
+1.881
-20.59%
jan 1, 1997
-4.19
+3.063
-42.23%
jan 1, 1998
-0.688
+3.502
-83.58%
jan 1, 1999
1.875
+2.563
-372.47%
jan 1, 2000
1.853
-0.022
-1.16%
jan 1, 2001
6.661
+4.808
259.44%
jan 1, 2002
5.406
-1.255
-18.84%
jan 1, 2003
4.439
-0.967
-17.89%
jan 1, 2004
3.12
-1.319
-29.71%
jan 1, 2005
2.981
-0.139
-4.46%
jan 1, 2006
3.314
+0.333
11.16%
jan 1, 2007
4.256
+0.942
28.44%
jan 1, 2008
5.307
+1.051
24.7%
jan 1, 2009
4.563
-0.743
-14.01%
jan 1, 2010
-1.907
-6.471
-141.8%
jan 1, 2011
-2.404
-0.496
26.01%
jan 1, 2012
-0.478
+1.925
-80.09%
jan 1, 2013
-1.054
-0.576
120.29%
jan 1, 2014
-1.788
-0.734
69.59%
jan 1, 2015
-2.511
-0.723
40.47%
Ranking of countries by current statistics by years


Comments: