29
/
en
AIzaSyAYiBZKx7MnpbEhh9jyipgxe19OcubqV5w
April 1, 2024
50291
Middle East & North Africa (IDA & IBRD countries)
TMN
false
2
1
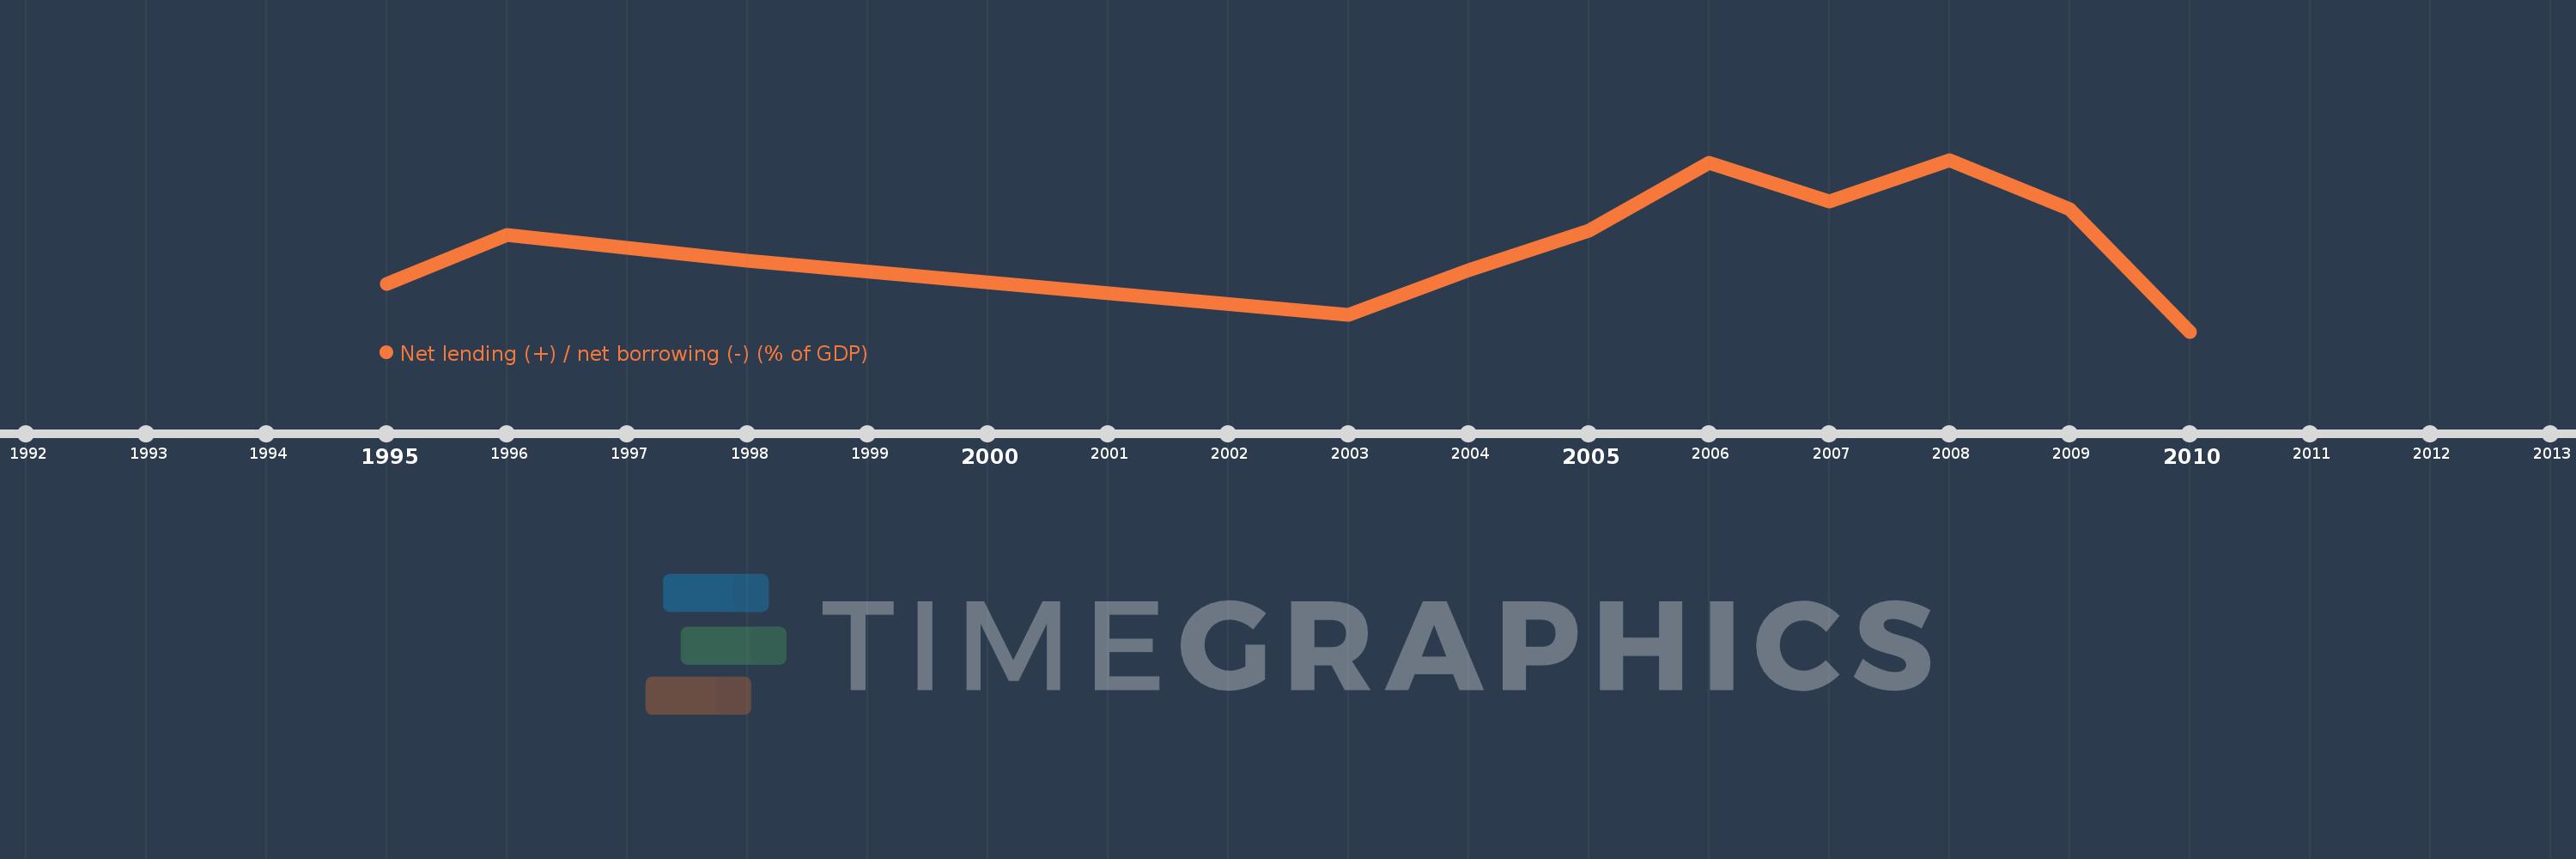
Net lending (+) / net borrowing (-) (% of GDP)
2010,2009,2008,2007,2006,2005,2004,2003,1998,1996,1995
This statistics in other country:
AfghanistanAlbaniaAlgeriaAngolaAntigua and BarbudaArmeniaAustraliaAustriaAzerbaijanBahamas, TheBahrainBangladeshBarbadosBelarusBelgiumBelizeBhutanBoliviaBosnia and HerzegovinaBrazilBurundiCabo VerdeCambodiaCanadaCaribbean small statesCentral African RepublicCentral Europe and the BalticsChileCongo, Dem. Rep.Congo, Rep.Costa RicaCote d'IvoireCroatiaCyprusCzech RepublicDenmarkDominicaDominican RepublicEarly-demographic dividendEgypt, Arab Rep.El SalvadorEquatorial GuineaEstoniaEthiopiaEuro areaEurope & Central AsiaEurope & Central Asia (excluding high income)Europe & Central Asia (IDA & IBRD countries)European UnionFijiFinlandFranceGambia, TheGeorgiaGermanyGreeceGuatemalaHigh incomeHondurasHungaryIcelandIDA blendIndiaIndonesiaIran, Islamic Rep.IraqIrelandIsraelItalyJamaicaKazakhstanKiribatiKorea, Rep.Kyrgyz RepublicLao PDRLatin America & Caribbean Latin America & Caribbean (excluding high income)Latin America & the Caribbean (IDA & IBRD countries)LatviaLebanonLithuaniaLower middle incomeLuxembourgMacao SAR, ChinaMacedonia, FYRMadagascarMalawiMaldivesMaliMaltaMauritiusMexicoMicronesia, Fed. Sts.Middle East & North Africa (excluding high income)Middle East & North Africa (IDA & IBRD countries)MoldovaMongoliaMoroccoMozambiqueNamibiaNepalNetherlandsNew ZealandNicaraguaNigeriaNorth AmericaNorwayOECD membersOmanOther small statesPacific island small statesPakistanParaguayPeruPhilippinesPolandPortugalPost-demographic dividendQatarRomaniaRussian FederationRwandaSamoaSan MarinoSao Tome and PrincipeSenegalSerbiaSierra LeoneSingaporeSlovak RepublicSmall statesSolomon IslandsSouth AfricaSouth AsiaSouth Asia (IDA & IBRD)SpainSri LankaSub-Saharan Africa Sub-Saharan Africa (excluding high income)Sub-Saharan Africa (IDA & IBRD countries)SurinameSwazilandSwedenSwitzerlandSyrian Arab RepublicThailandTimor-LesteTrinidad and TobagoTurkeyUgandaUkraineUnited Arab EmiratesUnited KingdomUnited StatesUruguayVanuatuVietnamWest Bank and GazaWorldYemen, Rep.Zimbabwe Timeline:
This timeline shows a graph from 1995 to 2010 of Middle East & North Africa (IDA & IBRD countries). No data until 1994. Number of actual observations by date: 11.
Source name:
World Development Indicators
Source organization:
International Monetary Fund, Government Finance Statistics Yearbook and data files.
Categories, topics:
Public Sector
Last updated:
apr 23, 2017
Indicators value changes by year
Minimum:
-2.141
jan 1, 2010
At the date of observation
Value
Absolute change
Change from previous value
jan 1, 1995
-0.852
-0.852
0.0%
jan 1, 1996
0.495
+1.347
-158.03%
jan 1, 1998
-0.201
-0.695
-140.6%
jan 1, 2003
-1.692
-1.491
742.68%
jan 1, 2004
-0.471
+1.221
-72.15%
jan 1, 2005
0.599
+1.07
-227.14%
jan 1, 2006
2.446
+1.847
308.22%
jan 1, 2007
1.391
-1.055
-43.13%
jan 1, 2008
2.537
+1.146
82.39%
jan 1, 2009
1.198
-1.338
-52.76%
jan 1, 2010
-2.141
-3.339
-278.64%
Ranking of countries by current statistics by years


Comments: