29
/
en
AIzaSyAYiBZKx7MnpbEhh9jyipgxe19OcubqV5w
April 1, 2024
153847
Iceland
ISL
true
2
1
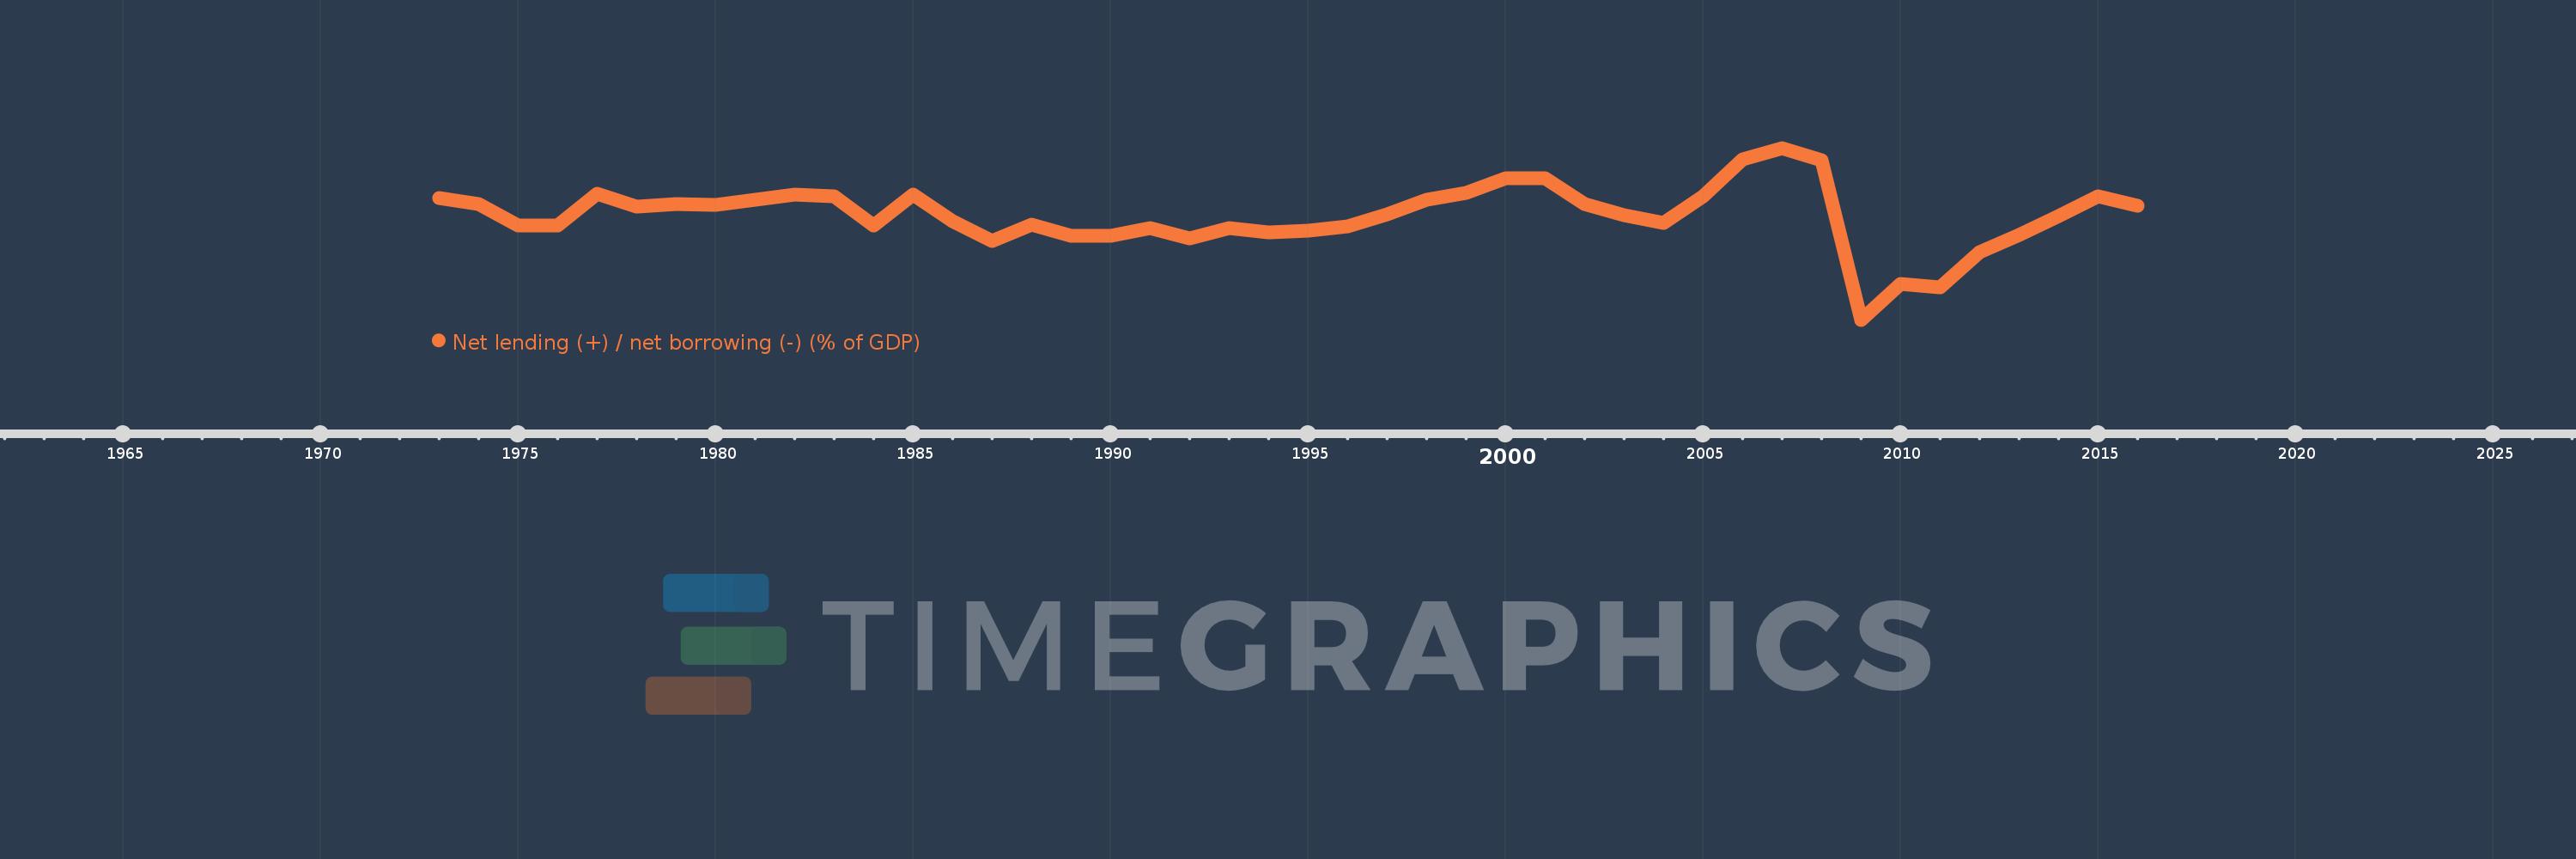
Net lending (+) / net borrowing (-) (% of GDP)
2016,2015,2014,2013,2012,2011,2010,2009,2008,2007,2006,2005,2004,2003,2002,2001,2000,1999,1998,1997,1996,1995,1994,1993,1992,1991,1990,1989,1988,1987,1986,1985,1984,1983,1982,1981,1980,1979,1978,1977,1976,1975,1974,1973
This statistics in other country:
AfghanistanAlbaniaAlgeriaAngolaAntigua and BarbudaArmeniaAustraliaAustriaAzerbaijanBahamas, TheBahrainBangladeshBarbadosBelarusBelgiumBelizeBhutanBoliviaBosnia and HerzegovinaBrazilBurundiCabo VerdeCambodiaCanadaCaribbean small statesCentral African RepublicCentral Europe and the BalticsChileCongo, Dem. Rep.Congo, Rep.Costa RicaCote d'IvoireCroatiaCyprusCzech RepublicDenmarkDominicaDominican RepublicEarly-demographic dividendEgypt, Arab Rep.El SalvadorEquatorial GuineaEstoniaEthiopiaEuro areaEurope & Central AsiaEurope & Central Asia (excluding high income)Europe & Central Asia (IDA & IBRD countries)European UnionFijiFinlandFranceGambia, TheGeorgiaGermanyGreeceGuatemalaHigh incomeHondurasHungaryIcelandIDA blendIndiaIndonesiaIran, Islamic Rep.IraqIrelandIsraelItalyJamaicaKazakhstanKiribatiKorea, Rep.Kyrgyz RepublicLao PDRLatin America & Caribbean Latin America & Caribbean (excluding high income)Latin America & the Caribbean (IDA & IBRD countries)LatviaLebanonLithuaniaLower middle incomeLuxembourgMacao SAR, ChinaMacedonia, FYRMadagascarMalawiMaldivesMaliMaltaMauritiusMexicoMicronesia, Fed. Sts.Middle East & North Africa (excluding high income)Middle East & North Africa (IDA & IBRD countries)MoldovaMongoliaMoroccoMozambiqueNamibiaNepalNetherlandsNew ZealandNicaraguaNigeriaNorth AmericaNorwayOECD membersOmanOther small statesPacific island small statesPakistanParaguayPeruPhilippinesPolandPortugalPost-demographic dividendQatarRomaniaRussian FederationRwandaSamoaSan MarinoSao Tome and PrincipeSenegalSerbiaSierra LeoneSingaporeSlovak RepublicSmall statesSolomon IslandsSouth AfricaSouth AsiaSouth Asia (IDA & IBRD)SpainSri LankaSub-Saharan Africa Sub-Saharan Africa (excluding high income)Sub-Saharan Africa (IDA & IBRD countries)SurinameSwazilandSwedenSwitzerlandSyrian Arab RepublicThailandTimor-LesteTrinidad and TobagoTurkeyUgandaUkraineUnited Arab EmiratesUnited KingdomUnited StatesUruguayVanuatuVietnamWest Bank and GazaWorldYemen, Rep.Zimbabwe Timeline:
This timeline shows a graph from 1973 to 2016 of Iceland. No data until 1972. Number of actual observations by date: 44.
Source name:
World Development Indicators
Source organization:
International Monetary Fund, Government Finance Statistics Yearbook and data files.
Categories, topics:
Public Sector
Last updated:
apr 23, 2017
Indicators value changes by year
Minimum:
-12.148
jan 1, 2009
At the date of observation
Value
Absolute change
Change from previous value
jan 1, 1973
0.616
+0.616
0.0%
jan 1, 1974
-0.057
-0.673
-109.29%
jan 1, 1975
-2.227
-2.17
3.79K%
jan 1, 1976
-2.289
-0.062
2.79%
jan 1, 1977
1.034
+3.323
-145.17%
jan 1, 1978
-0.327
-1.361
-131.67%
jan 1, 1979
-0.012
+0.316
-96.44%
jan 1, 1980
-0.134
-0.122
1.05K%
jan 1, 1981
0.463
+0.598
-445.67%
jan 1, 1982
0.949
+0.486
104.83%
jan 1, 1983
0.796
-0.153
-16.11%
jan 1, 1984
-2.282
-3.079
-386.57%
jan 1, 1985
0.961
+3.243
-142.1%
jan 1, 1986
-1.838
-2.799
-291.27%
jan 1, 1987
-3.897
-2.059
112.06%
jan 1, 1988
-2.148
+1.749
-44.87%
jan 1, 1989
-3.364
-1.216
56.6%
jan 1, 1990
-3.326
+0.038
-1.14%
jan 1, 1991
-2.55
+0.776
-23.32%
jan 1, 1992
-3.658
-1.108
43.45%
jan 1, 1993
-2.582
+1.076
-29.42%
jan 1, 1994
-3.003
-0.421
16.31%
jan 1, 1995
-2.829
+0.173
-5.78%
jan 1, 1996
-2.391
+0.438
-15.48%
jan 1, 1997
-1.13
+1.262
-52.75%
jan 1, 1998
0.41
+1.54
-136.31%
jan 1, 1999
1.178
+0.768
187.18%
jan 1, 2000
2.7
+1.522
129.17%
jan 1, 2001
2.641
-0.059
-2.18%
jan 1, 2002
-0.059
-2.7
-102.22%
jan 1, 2003
-1.209
-1.15
1.96K%
jan 1, 2004
-2.004
-0.795
65.74%
jan 1, 2005
0.771
+2.774
-138.46%
jan 1, 2006
4.663
+3.892
505.11%
jan 1, 2007
5.859
+1.196
25.64%
jan 1, 2008
4.598
-1.261
-21.52%
jan 1, 2009
-12.148
-16.745
-364.21%
jan 1, 2010
-8.436
+3.712
-30.55%
jan 1, 2011
-8.755
-0.319
3.78%
jan 1, 2012
-5.052
+3.703
-42.29%
jan 1, 2013
-3.264
+1.788
-35.4%
jan 1, 2014
-1.265
+1.999
-61.25%
jan 1, 2015
0.746
+2.011
-158.98%
jan 1, 2016
-0.221
-0.967
-129.57%
Ranking of countries by current statistics by years


Comments: