29
/
en
AIzaSyAYiBZKx7MnpbEhh9jyipgxe19OcubqV5w
April 1, 2024
201322
Morocco
MAR
true
2
1
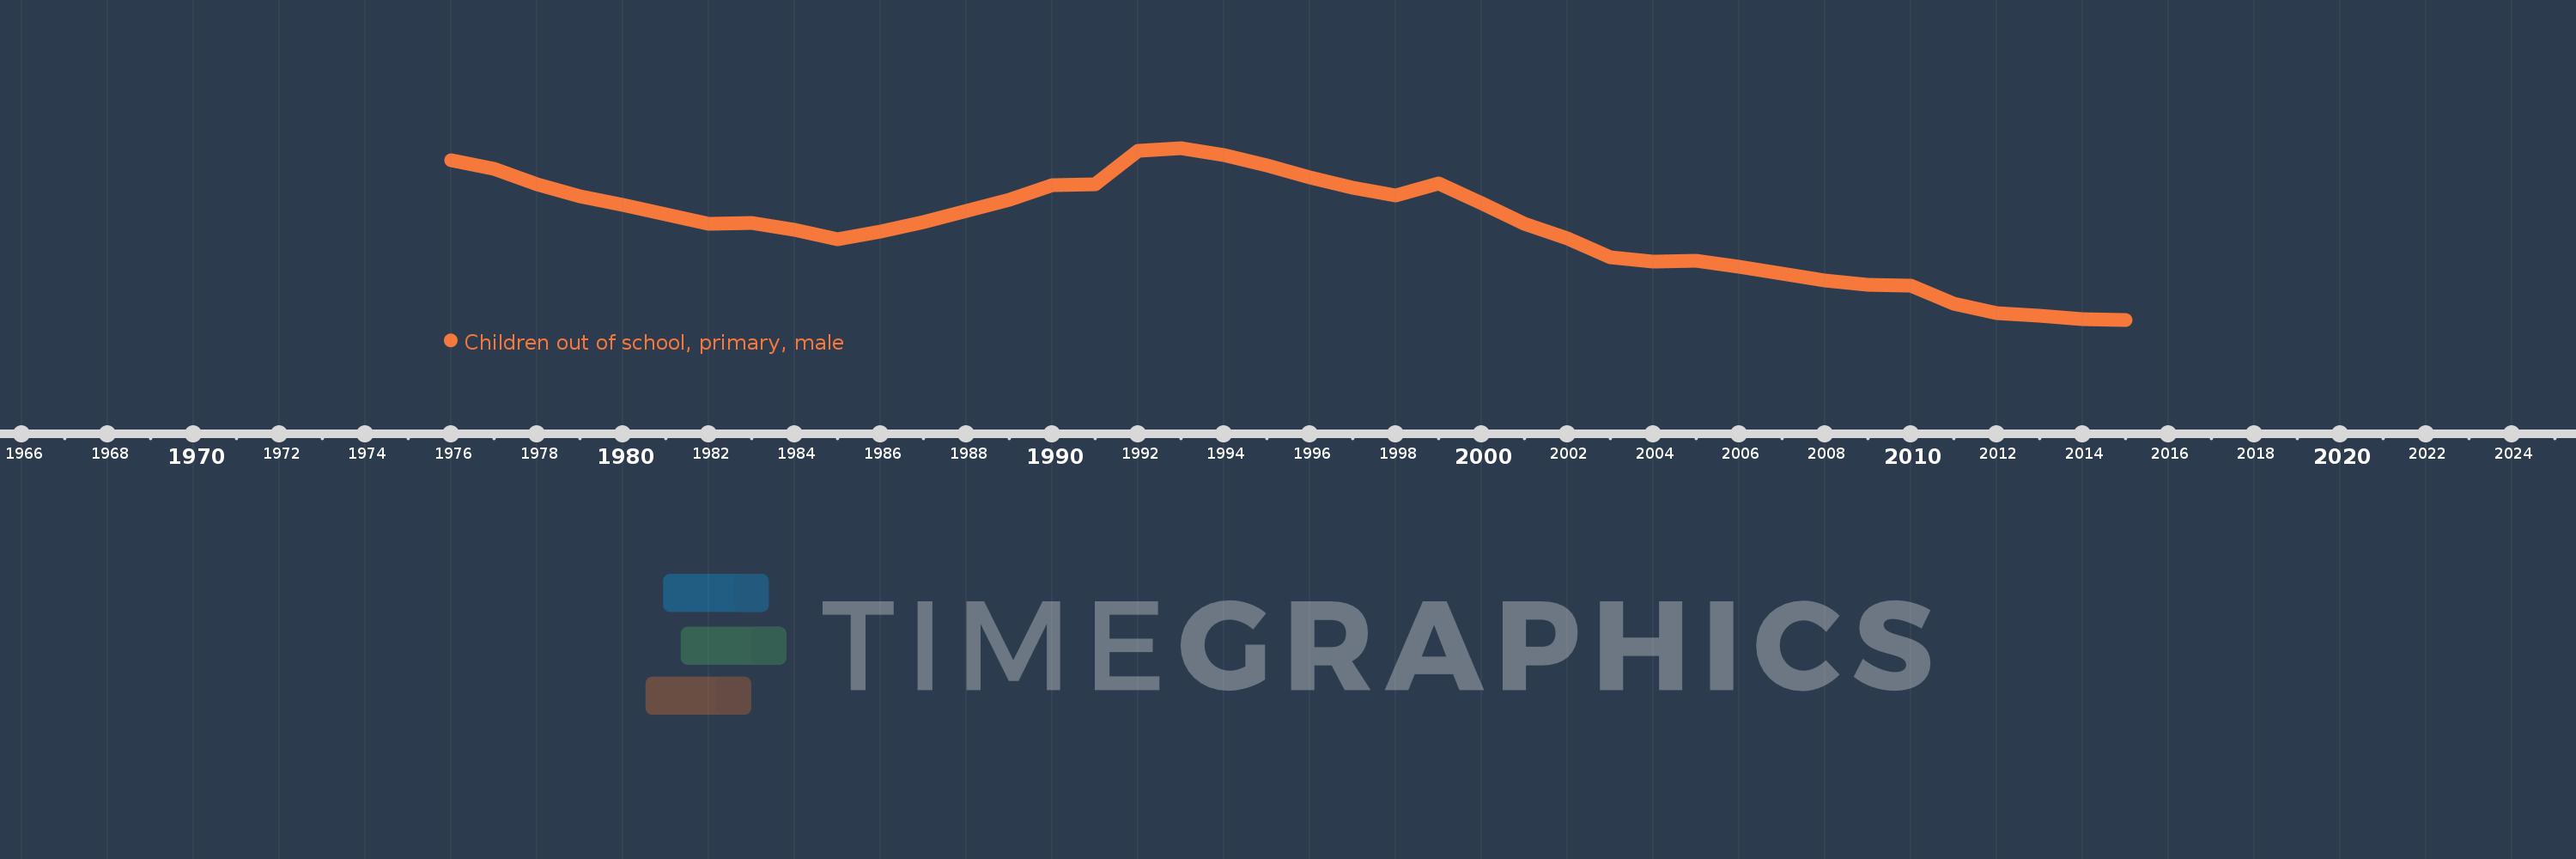
Children out of school, primary, male
2015,2014,2013,2012,2011,2010,2009,2008,2007,2006,2005,2004,2003,2002,2001,2000,1999,1998,1997,1996,1995,1994,1993,1992,1991,1990,1989,1988,1987,1986,1985,1984,1983,1982,1981,1980,1979,1978,1977,1976
This statistics in other country:
AfghanistanAlbaniaAlgeriaAngolaAntigua and BarbudaArab WorldArgentinaArmeniaArubaAustraliaAustriaAzerbaijanBahamas, TheBahrainBangladeshBarbadosBelarusBelgiumBelizeBeninBermudaBhutanBoliviaBosnia and HerzegovinaBotswanaBrazilBrunei DarussalamBulgariaBurkina FasoBurundiCabo VerdeCambodiaCameroonCanadaCaribbean small statesCentral African RepublicCentral Europe and the BalticsChadChileChinaColombiaComorosCongo, Dem. Rep.Congo, Rep.Costa RicaCote d'IvoireCroatiaCubaCyprusDenmarkDjiboutiDominicaDominican RepublicEarly-demographic dividendEast Asia & PacificEast Asia & Pacific (excluding high income)East Asia & Pacific (IDA & IBRD countries)EcuadorEgypt, Arab Rep.El SalvadorEquatorial GuineaEritreaEstoniaEthiopiaEuro areaEurope & Central AsiaEurope & Central Asia (excluding high income)Europe & Central Asia (IDA & IBRD countries)European UnionFijiFinlandFragile and conflict affected situationsFranceGabonGambia, TheGeorgiaGhanaGreeceGrenadaGuatemalaGuineaGuinea-BissauGuyanaHaitiHeavily indebted poor countries (HIPC)High incomeHondurasHong Kong SAR, ChinaHungaryIBRD onlyIcelandIDA & IBRD totalIDA blendIDA onlyIDA totalIndiaIndonesiaIran, Islamic Rep.IraqIrelandIsraelItalyJamaicaJapanJordanKazakhstanKenyaKiribatiKorea, Dem. People’s Rep.Korea, Rep.KuwaitKyrgyz RepublicLao PDRLate-demographic dividendLatin America & Caribbean Latin America & Caribbean (excluding high income)Latin America & the Caribbean (IDA & IBRD countries)LatviaLeast developed countries: UN classificationLebanonLesothoLiberiaLibyaLiechtensteinLithuaniaLow & middle incomeLow incomeLower middle incomeLuxembourgMacao SAR, ChinaMacedonia, FYRMadagascarMalawiMaldivesMaliMaltaMarshall IslandsMauritaniaMauritiusMexicoMicronesia, Fed. Sts.Middle East & North AfricaMiddle East & North Africa (excluding high income)Middle East & North Africa (IDA & IBRD countries)Middle incomeMoldovaMongoliaMontenegroMoroccoMozambiqueMyanmarNamibiaNauruNepalNetherlandsNew ZealandNicaraguaNigerNigeriaNorth AmericaNorwayOECD membersOmanOther small statesPacific island small statesPakistanPanamaPapua New GuineaParaguayPeruPhilippinesPolandPortugalPost-demographic dividendPre-demographic dividendPuerto RicoQatarRomaniaRussian FederationRwandaSamoaSan MarinoSao Tome and PrincipeSaudi ArabiaSenegalSerbiaSeychellesSierra LeoneSloveniaSmall statesSolomon IslandsSomaliaSouth AfricaSouth AsiaSouth Asia (IDA & IBRD)South SudanSpainSri LankaSt. Kitts and NevisSt. LuciaSt. Vincent and the GrenadinesSub-Saharan Africa Sub-Saharan Africa (excluding high income)Sub-Saharan Africa (IDA & IBRD countries)SudanSurinameSwazilandSwedenSwitzerlandSyrian Arab RepublicTajikistanTanzaniaThailandTimor-LesteTogoTongaTrinidad and TobagoTunisiaTurkeyTuvaluUgandaUkraineUnited Arab EmiratesUnited KingdomUnited StatesUpper middle incomeUruguayUzbekistanVanuatuVenezuela, RBWest Bank and GazaWorldYemen, Rep.ZambiaZimbabwe Timeline:
This timeline shows a graph from 1976 to 2015 of Morocco. No data until 1975. Number of actual observations by date: 40.
Source name:
World Development Indicators
Source organization:
United Nations Educational, Scientific, and Cultural Organization (UNESCO) Institute for Statistics.
Categories, topics:
Education, Gender
Last updated:
apr 23, 2017
Indicators value changes by year
Minimum:
17.183K
jan 1, 2015
Maximum:
708.501K
jan 1, 1993
At the date of observation
Value
Absolute change
Change from previous value
jan 1, 1976
657.831K
+657.831K
0.0%
jan 1, 1977
623.632K
-34.199K
-5.2%
jan 1, 1978
561.413K
-62.219K
-9.98%
jan 1, 1979
512.652K
-48.761K
-8.69%
jan 1, 1980
478.982K
-33.67K
-6.57%
jan 1, 1981
440.723K
-38.259K
-7.99%
jan 1, 1982
403.278K
-37.445K
-8.5%
jan 1, 1983
407.37K
+4.092K
1.01%
jan 1, 1984
378.072K
-29.298K
-7.19%
jan 1, 1985
340.858K
-37.214K
-9.84%
jan 1, 1986
370.999K
+30.141K
8.84%
jan 1, 1987
409.853K
+38.854K
10.47%
jan 1, 1988
455.811K
+45.958K
11.21%
jan 1, 1989
501.171K
+45.36K
9.95%
jan 1, 1990
557.567K
+56.396K
11.25%
jan 1, 1991
563.642K
+6.075K
1.09%
jan 1, 1992
695.44K
+131.798K
23.38%
jan 1, 1993
708.501K
+13.061K
1.88%
jan 1, 1994
679.088K
-29.413K
-4.15%
jan 1, 1995
638.721K
-40.367K
-5.94%
jan 1, 1996
588.901K
-49.82K
-7.8%
jan 1, 1997
547.04K
-41.861K
-7.11%
jan 1, 1998
518.767K
-28.273K
-5.17%
jan 1, 1999
564.105K
+45.338K
8.74%
jan 1, 2000
485.458K
-78.647K
-13.94%
jan 1, 2001
405.001K
-80.457K
-16.57%
jan 1, 2002
344.822K
-60.179K
-14.86%
jan 1, 2003
269.537K
-75.285K
-21.83%
jan 1, 2004
250.183K
-19.354K
-7.18%
jan 1, 2005
254.772K
+4.589K
1.83%
jan 1, 2006
231.489K
-23.283K
-9.14%
jan 1, 2007
202.139K
-29.35K
-12.68%
jan 1, 2008
176.606K
-25.533K
-12.63%
jan 1, 2009
157.251K
-19.355K
-10.96%
jan 1, 2010
154.935K
-2.316K
-1.47%
jan 1, 2011
81.561K
-73.374K
-47.36%
jan 1, 2012
42.731K
-38.83K
-47.61%
jan 1, 2013
35.02K
-7.711K
-18.05%
jan 1, 2014
18.617K
-16.403K
-46.84%
jan 1, 2015
17.183K
-1.434K
-7.7%
Ranking of countries by current statistics by years


Comments: