29
/
en
AIzaSyAYiBZKx7MnpbEhh9jyipgxe19OcubqV5w
April 1, 2024
49845
Middle East & North Africa (IDA & IBRD countries)
TMN
false
2
1
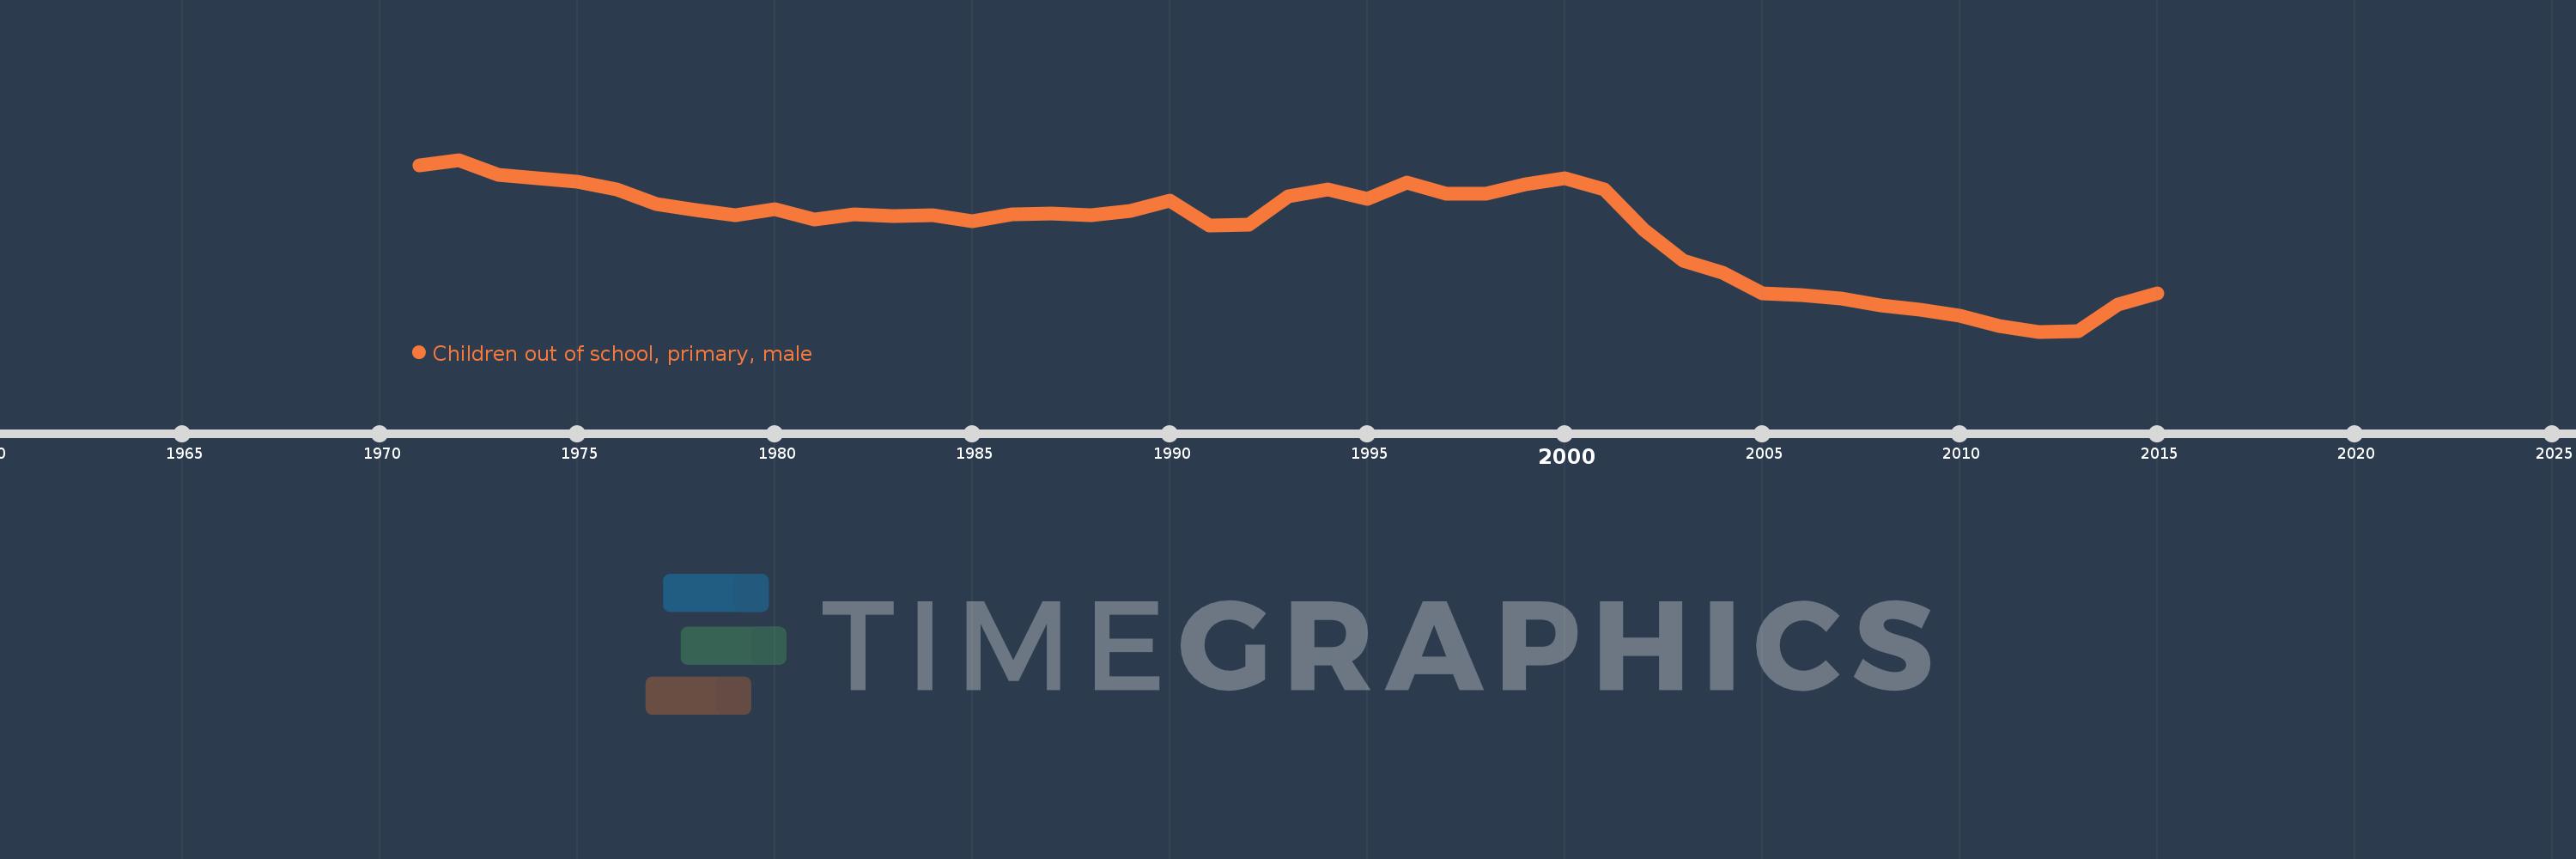
Children out of school, primary, male
2015,2014,2013,2012,2011,2010,2009,2008,2007,2006,2005,2004,2003,2002,2001,2000,1999,1998,1997,1996,1995,1994,1993,1992,1991,1990,1989,1988,1987,1986,1985,1984,1983,1982,1981,1980,1979,1978,1977,1976,1975,1974,1973,1972,1971
This statistics in other country:
AfghanistanAlbaniaAlgeriaAngolaAntigua and BarbudaArab WorldArgentinaArmeniaArubaAustraliaAustriaAzerbaijanBahamas, TheBahrainBangladeshBarbadosBelarusBelgiumBelizeBeninBermudaBhutanBoliviaBosnia and HerzegovinaBotswanaBrazilBrunei DarussalamBulgariaBurkina FasoBurundiCabo VerdeCambodiaCameroonCanadaCaribbean small statesCentral African RepublicCentral Europe and the BalticsChadChileChinaColombiaComorosCongo, Dem. Rep.Congo, Rep.Costa RicaCote d'IvoireCroatiaCubaCyprusDenmarkDjiboutiDominicaDominican RepublicEarly-demographic dividendEast Asia & PacificEast Asia & Pacific (excluding high income)East Asia & Pacific (IDA & IBRD countries)EcuadorEgypt, Arab Rep.El SalvadorEquatorial GuineaEritreaEstoniaEthiopiaEuro areaEurope & Central AsiaEurope & Central Asia (excluding high income)Europe & Central Asia (IDA & IBRD countries)European UnionFijiFinlandFragile and conflict affected situationsFranceGabonGambia, TheGeorgiaGhanaGreeceGrenadaGuatemalaGuineaGuinea-BissauGuyanaHaitiHeavily indebted poor countries (HIPC)High incomeHondurasHong Kong SAR, ChinaHungaryIBRD onlyIcelandIDA & IBRD totalIDA blendIDA onlyIDA totalIndiaIndonesiaIran, Islamic Rep.IraqIrelandIsraelItalyJamaicaJapanJordanKazakhstanKenyaKiribatiKorea, Dem. People’s Rep.Korea, Rep.KuwaitKyrgyz RepublicLao PDRLate-demographic dividendLatin America & Caribbean Latin America & Caribbean (excluding high income)Latin America & the Caribbean (IDA & IBRD countries)LatviaLeast developed countries: UN classificationLebanonLesothoLiberiaLibyaLiechtensteinLithuaniaLow & middle incomeLow incomeLower middle incomeLuxembourgMacao SAR, ChinaMacedonia, FYRMadagascarMalawiMaldivesMaliMaltaMarshall IslandsMauritaniaMauritiusMexicoMicronesia, Fed. Sts.Middle East & North AfricaMiddle East & North Africa (excluding high income)Middle East & North Africa (IDA & IBRD countries)Middle incomeMoldovaMongoliaMontenegroMoroccoMozambiqueMyanmarNamibiaNauruNepalNetherlandsNew ZealandNicaraguaNigerNigeriaNorth AmericaNorwayOECD membersOmanOther small statesPacific island small statesPakistanPanamaPapua New GuineaParaguayPeruPhilippinesPolandPortugalPost-demographic dividendPre-demographic dividendPuerto RicoQatarRomaniaRussian FederationRwandaSamoaSan MarinoSao Tome and PrincipeSaudi ArabiaSenegalSerbiaSeychellesSierra LeoneSloveniaSmall statesSolomon IslandsSomaliaSouth AfricaSouth AsiaSouth Asia (IDA & IBRD)South SudanSpainSri LankaSt. Kitts and NevisSt. LuciaSt. Vincent and the GrenadinesSub-Saharan Africa Sub-Saharan Africa (excluding high income)Sub-Saharan Africa (IDA & IBRD countries)SudanSurinameSwazilandSwedenSwitzerlandSyrian Arab RepublicTajikistanTanzaniaThailandTimor-LesteTogoTongaTrinidad and TobagoTunisiaTurkeyTuvaluUgandaUkraineUnited Arab EmiratesUnited KingdomUnited StatesUpper middle incomeUruguayUzbekistanVanuatuVenezuela, RBWest Bank and GazaWorldYemen, Rep.ZambiaZimbabwe Timeline:
This timeline shows a graph from 1971 to 2015 of Middle East & North Africa (IDA & IBRD countries). No data until 1970. Number of actual observations by date: 45.
Source name:
World Development Indicators
Source organization:
United Nations Educational, Scientific, and Cultural Organization (UNESCO) Institute for Statistics.
Categories, topics:
Education, Gender
Last updated:
apr 23, 2017
Indicators value changes by year
Minimum:
388.607K
jan 1, 2012
Maximum:
2.576 mln
jan 1, 1972
At the date of observation
Value
Absolute change
Change from previous value
jan 1, 1971
2.504 mln
+2.504 mln
0.0%
jan 1, 1972
2.576 mln
+72.599K
2.9%
jan 1, 1973
2.381 mln
-195.379K
-7.58%
jan 1, 1974
2.337 mln
-43.846K
-1.84%
jan 1, 1975
2.298 mln
-39.668K
-1.7%
jan 1, 1976
2.199 mln
-98.776K
-4.3%
jan 1, 1977
2.012 mln
-186.484K
-8.48%
jan 1, 1978
1.938 mln
-74.816K
-3.72%
jan 1, 1979
1.876 mln
-61.693K
-3.18%
jan 1, 1980
1.95 mln
+74.216K
3.96%
jan 1, 1981
1.812 mln
-137.582K
-7.06%
jan 1, 1982
1.877 mln
+64.647K
3.57%
jan 1, 1983
1.855 mln
-22.204K
-1.18%
jan 1, 1984
1.869 mln
+14.383K
0.78%
jan 1, 1985
1.797 mln
-72.613K
-3.88%
jan 1, 1986
1.883 mln
+86.64K
4.82%
jan 1, 1987
1.893 mln
+9.759K
0.52%
jan 1, 1988
1.868 mln
-25.204K
-1.33%
jan 1, 1989
1.924 mln
+56.038K
3.0%
jan 1, 1990
2.052 mln
+128.278K
6.67%
jan 1, 1991
1.742 mln
-310.053K
-15.11%
jan 1, 1992
1.755 mln
+13.305K
0.76%
jan 1, 1993
2.112 mln
+356.942K
20.33%
jan 1, 1994
2.201 mln
+88.318K
4.18%
jan 1, 1995
2.078 mln
-122.405K
-5.56%
jan 1, 1996
2.287 mln
+208.488K
10.03%
jan 1, 1997
2.142 mln
-145.261K
-6.35%
jan 1, 1998
2.149 mln
+7.133K
0.33%
jan 1, 1999
2.263 mln
+114.82K
5.34%
jan 1, 2000
2.34 mln
+76.948K
3.4%
jan 1, 2001
2.194 mln
-145.926K
-6.24%
jan 1, 2002
1.681 mln
-513.895K
-23.42%
jan 1, 2003
1.289 mln
-391.735K
-23.31%
jan 1, 2004
1.135 mln
-153.482K
-11.91%
jan 1, 2005
880.215K
-255.166K
-22.47%
jan 1, 2006
852.071K
-28.144K
-3.2%
jan 1, 2007
808.344K
-43.727K
-5.13%
jan 1, 2008
720.447K
-87.897K
-10.87%
jan 1, 2009
671.3K
-49.147K
-6.82%
jan 1, 2010
591.676K
-79.624K
-11.86%
jan 1, 2011
455.445K
-136.231K
-23.02%
jan 1, 2012
388.607K
-66.838K
-14.68%
jan 1, 2013
390.767K
+2.16K
0.56%
jan 1, 2014
728.278K
+337.511K
86.37%
jan 1, 2015
872.324K
+144.046K
19.78%
Ranking of countries by current statistics by years


Comments: