29
/
en
AIzaSyAYiBZKx7MnpbEhh9jyipgxe19OcubqV5w
April 1, 2024
27921
East Asia & Pacific (excluding high income)
EAP
false
2
1
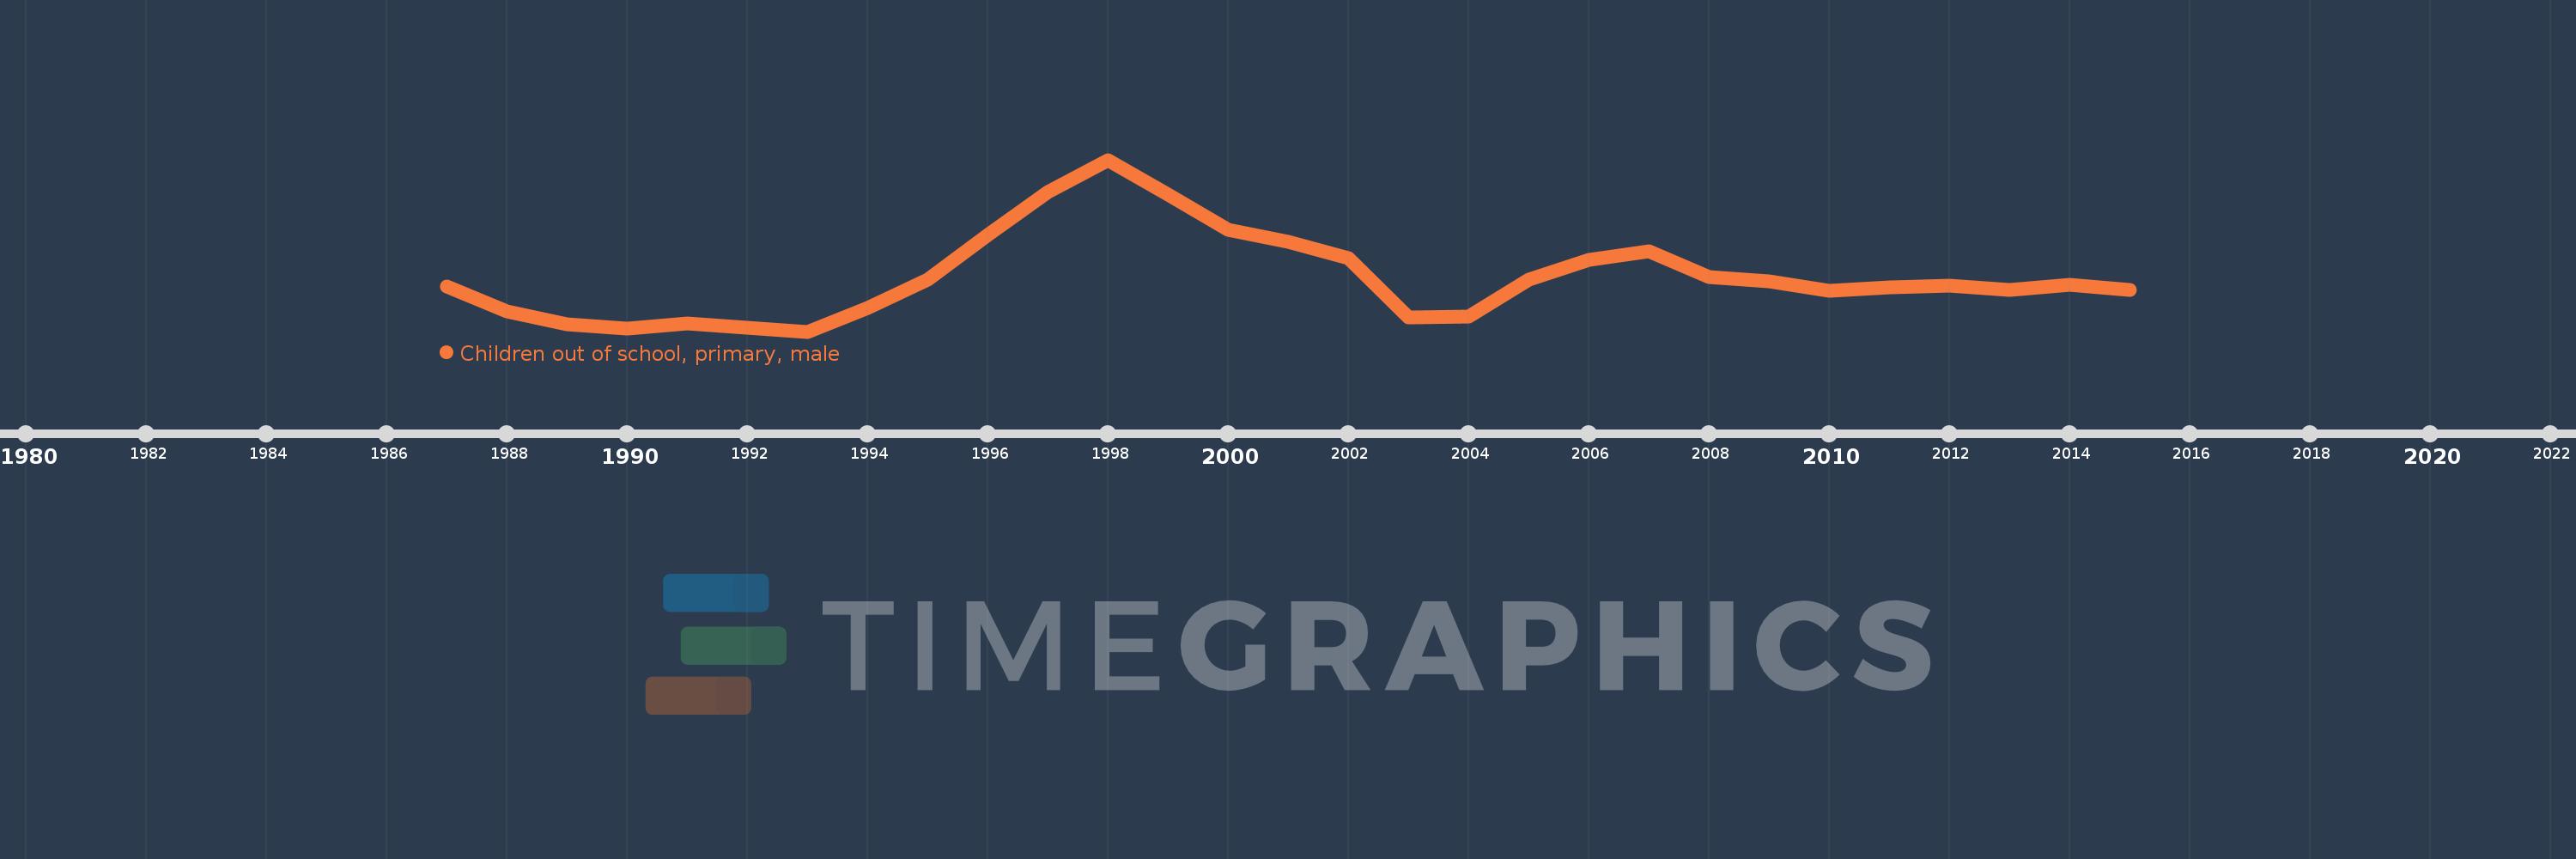
Children out of school, primary, male
2015,2014,2013,2012,2011,2010,2009,2008,2007,2006,2005,2004,2003,2002,2001,2000,1999,1998,1997,1996,1995,1994,1993,1992,1991,1990,1989,1988,1987
This statistics in other country:
AfghanistanAlbaniaAlgeriaAngolaAntigua and BarbudaArab WorldArgentinaArmeniaArubaAustraliaAustriaAzerbaijanBahamas, TheBahrainBangladeshBarbadosBelarusBelgiumBelizeBeninBermudaBhutanBoliviaBosnia and HerzegovinaBotswanaBrazilBrunei DarussalamBulgariaBurkina FasoBurundiCabo VerdeCambodiaCameroonCanadaCaribbean small statesCentral African RepublicCentral Europe and the BalticsChadChileChinaColombiaComorosCongo, Dem. Rep.Congo, Rep.Costa RicaCote d'IvoireCroatiaCubaCyprusDenmarkDjiboutiDominicaDominican RepublicEarly-demographic dividendEast Asia & PacificEast Asia & Pacific (excluding high income)East Asia & Pacific (IDA & IBRD countries)EcuadorEgypt, Arab Rep.El SalvadorEquatorial GuineaEritreaEstoniaEthiopiaEuro areaEurope & Central AsiaEurope & Central Asia (excluding high income)Europe & Central Asia (IDA & IBRD countries)European UnionFijiFinlandFragile and conflict affected situationsFranceGabonGambia, TheGeorgiaGhanaGreeceGrenadaGuatemalaGuineaGuinea-BissauGuyanaHaitiHeavily indebted poor countries (HIPC)High incomeHondurasHong Kong SAR, ChinaHungaryIBRD onlyIcelandIDA & IBRD totalIDA blendIDA onlyIDA totalIndiaIndonesiaIran, Islamic Rep.IraqIrelandIsraelItalyJamaicaJapanJordanKazakhstanKenyaKiribatiKorea, Dem. People’s Rep.Korea, Rep.KuwaitKyrgyz RepublicLao PDRLate-demographic dividendLatin America & Caribbean Latin America & Caribbean (excluding high income)Latin America & the Caribbean (IDA & IBRD countries)LatviaLeast developed countries: UN classificationLebanonLesothoLiberiaLibyaLiechtensteinLithuaniaLow & middle incomeLow incomeLower middle incomeLuxembourgMacao SAR, ChinaMacedonia, FYRMadagascarMalawiMaldivesMaliMaltaMarshall IslandsMauritaniaMauritiusMexicoMicronesia, Fed. Sts.Middle East & North AfricaMiddle East & North Africa (excluding high income)Middle East & North Africa (IDA & IBRD countries)Middle incomeMoldovaMongoliaMontenegroMoroccoMozambiqueMyanmarNamibiaNauruNepalNetherlandsNew ZealandNicaraguaNigerNigeriaNorth AmericaNorwayOECD membersOmanOther small statesPacific island small statesPakistanPanamaPapua New GuineaParaguayPeruPhilippinesPolandPortugalPost-demographic dividendPre-demographic dividendPuerto RicoQatarRomaniaRussian FederationRwandaSamoaSan MarinoSao Tome and PrincipeSaudi ArabiaSenegalSerbiaSeychellesSierra LeoneSloveniaSmall statesSolomon IslandsSomaliaSouth AfricaSouth AsiaSouth Asia (IDA & IBRD)South SudanSpainSri LankaSt. Kitts and NevisSt. LuciaSt. Vincent and the GrenadinesSub-Saharan Africa Sub-Saharan Africa (excluding high income)Sub-Saharan Africa (IDA & IBRD countries)SudanSurinameSwazilandSwedenSwitzerlandSyrian Arab RepublicTajikistanTanzaniaThailandTimor-LesteTogoTongaTrinidad and TobagoTunisiaTurkeyTuvaluUgandaUkraineUnited Arab EmiratesUnited KingdomUnited StatesUpper middle incomeUruguayUzbekistanVanuatuVenezuela, RBWest Bank and GazaWorldYemen, Rep.ZambiaZimbabwe Timeline:
This timeline shows a graph from 1987 to 2015 of East Asia & Pacific (excluding high income). No data until 1986. Number of actual observations by date: 29.
Source name:
World Development Indicators
Source organization:
United Nations Educational, Scientific, and Cultural Organization (UNESCO) Institute for Statistics.
Categories, topics:
Education, Gender
Last updated:
apr 23, 2017
Indicators value changes by year
Minimum:
1.743 mln
jan 1, 1993
Maximum:
8.232 mln
jan 1, 1998
At the date of observation
Value
Absolute change
Change from previous value
jan 1, 1987
3.462 mln
+3.462 mln
0.0%
jan 1, 1988
2.491 mln
-970.759K
-28.04%
jan 1, 1989
2.023 mln
-468.041K
-18.79%
jan 1, 1990
1.843 mln
-180.161K
-8.91%
jan 1, 1991
2.064 mln
+221.696K
12.03%
jan 1, 1992
1.896 mln
-168.858K
-8.18%
jan 1, 1993
1.743 mln
-152.17K
-8.03%
jan 1, 1994
2.628 mln
+884.538K
50.73%
jan 1, 1995
3.714 mln
+1.086 mln
41.34%
jan 1, 1996
5.408 mln
+1.694 mln
45.59%
jan 1, 1997
7.031 mln
+1.623 mln
30.02%
jan 1, 1998
8.232 mln
+1.201 mln
17.08%
jan 1, 1999
6.904 mln
-1.328 mln
-16.13%
jan 1, 2000
5.585 mln
-1.319 mln
-19.11%
jan 1, 2001
5.126 mln
-459.812K
-8.23%
jan 1, 2002
4.505 mln
-620.949K
-12.11%
jan 1, 2003
2.281 mln
-2.224 mln
-49.36%
jan 1, 2004
2.309 mln
+27.878K
1.22%
jan 1, 2005
3.722 mln
+1.414 mln
61.23%
jan 1, 2006
4.468 mln
+745.145K
20.02%
jan 1, 2007
4.78 mln
+312.033K
6.98%
jan 1, 2008
3.817 mln
-962.716K
-20.14%
jan 1, 2009
3.647 mln
-169.704K
-4.45%
jan 1, 2010
3.28 mln
-366.969K
-10.06%
jan 1, 2011
3.405 mln
+124.399K
3.79%
jan 1, 2012
3.481 mln
+75.894K
2.23%
jan 1, 2013
3.33 mln
-150.267K
-4.32%
jan 1, 2014
3.518 mln
+187.62K
5.63%
jan 1, 2015
3.308 mln
-209.488K
-5.95%
Ranking of countries by current statistics by years


Comments: