29
/
en
AIzaSyAYiBZKx7MnpbEhh9jyipgxe19OcubqV5w
April 1, 2024
210100
Nicaragua
NIC
true
2
1
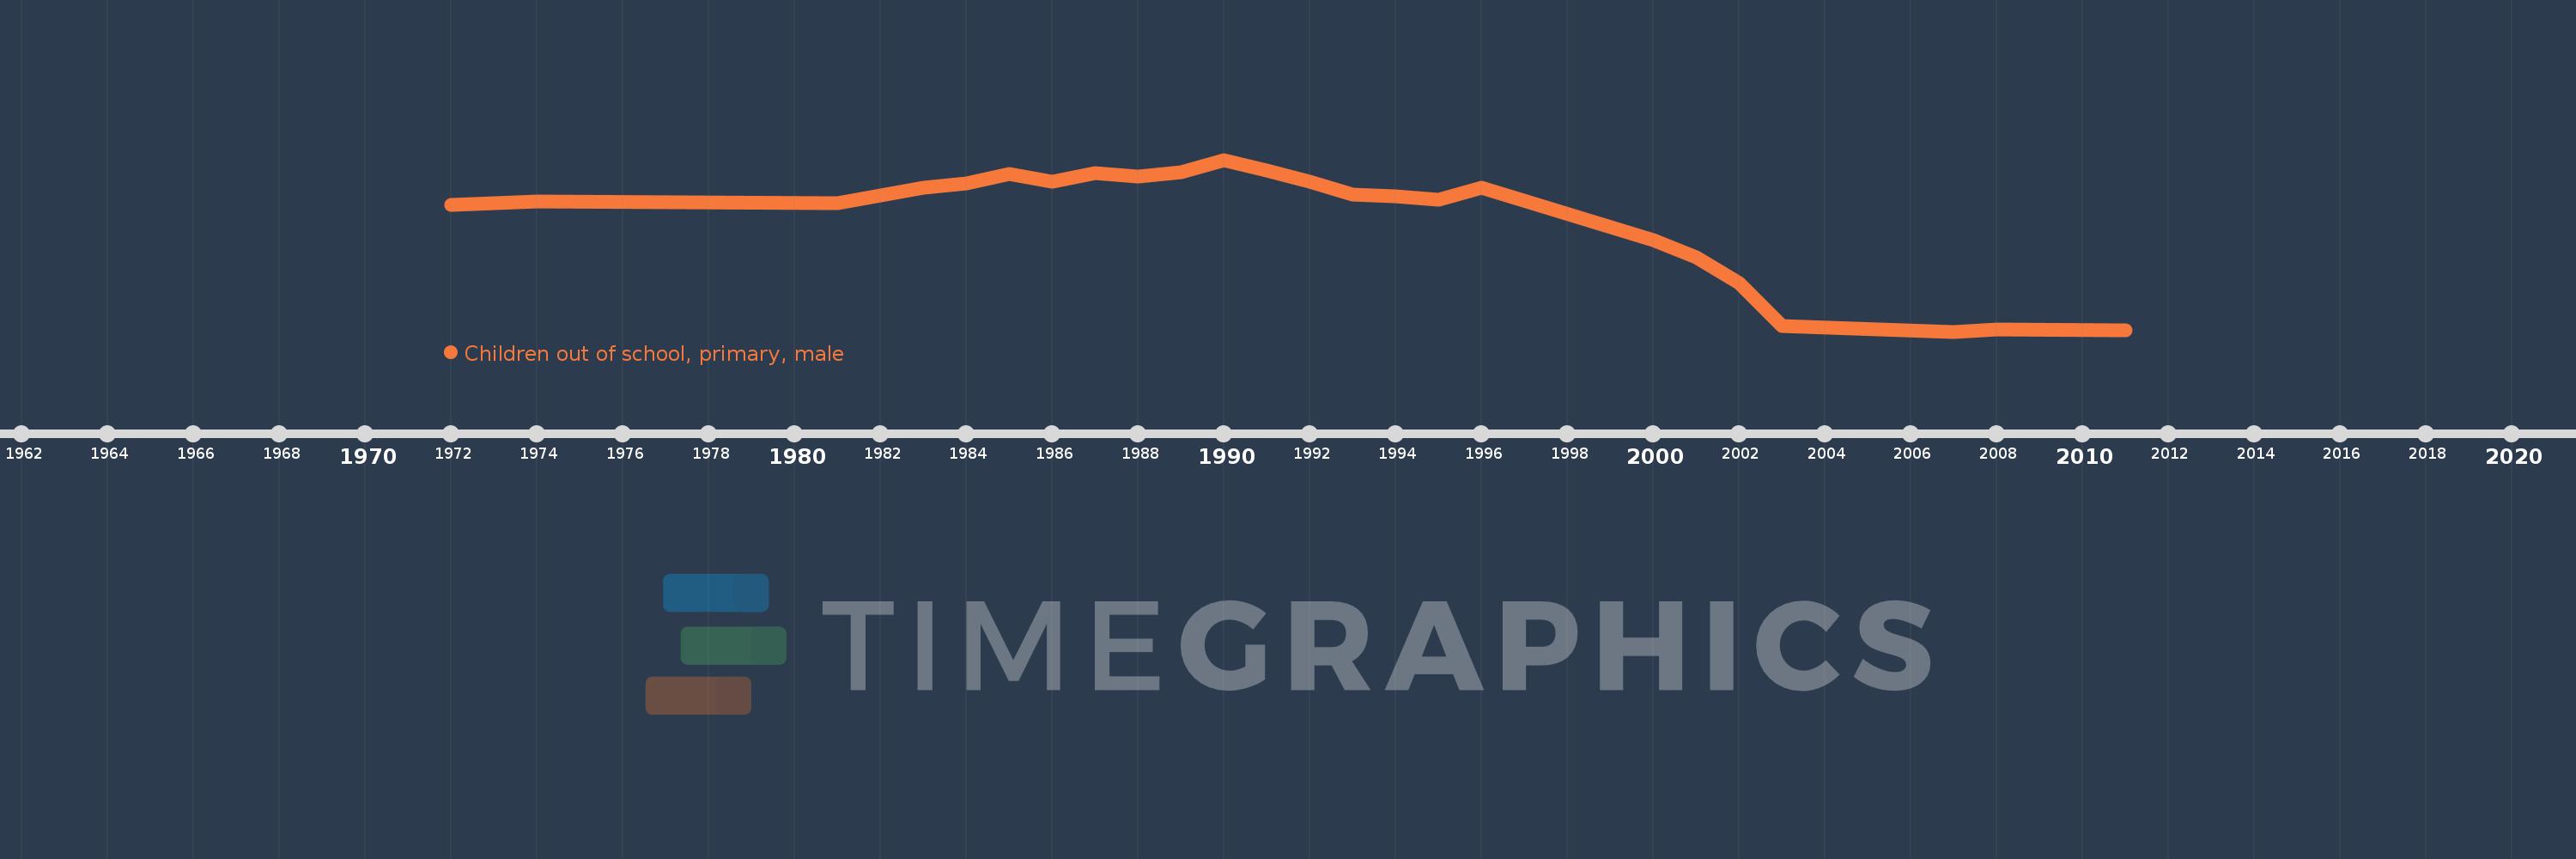
Children out of school, primary, male
2011,2008,2007,2003,2002,2001,2000,1996,1995,1994,1993,1992,1991,1990,1989,1988,1987,1986,1985,1984,1983,1981,1974,1972
This statistics in other country:
AfghanistanAlbaniaAlgeriaAngolaAntigua and BarbudaArab WorldArgentinaArmeniaArubaAustraliaAustriaAzerbaijanBahamas, TheBahrainBangladeshBarbadosBelarusBelgiumBelizeBeninBermudaBhutanBoliviaBosnia and HerzegovinaBotswanaBrazilBrunei DarussalamBulgariaBurkina FasoBurundiCabo VerdeCambodiaCameroonCanadaCaribbean small statesCentral African RepublicCentral Europe and the BalticsChadChileChinaColombiaComorosCongo, Dem. Rep.Congo, Rep.Costa RicaCote d'IvoireCroatiaCubaCyprusDenmarkDjiboutiDominicaDominican RepublicEarly-demographic dividendEast Asia & PacificEast Asia & Pacific (excluding high income)East Asia & Pacific (IDA & IBRD countries)EcuadorEgypt, Arab Rep.El SalvadorEquatorial GuineaEritreaEstoniaEthiopiaEuro areaEurope & Central AsiaEurope & Central Asia (excluding high income)Europe & Central Asia (IDA & IBRD countries)European UnionFijiFinlandFragile and conflict affected situationsFranceGabonGambia, TheGeorgiaGhanaGreeceGrenadaGuatemalaGuineaGuinea-BissauGuyanaHaitiHeavily indebted poor countries (HIPC)High incomeHondurasHong Kong SAR, ChinaHungaryIBRD onlyIcelandIDA & IBRD totalIDA blendIDA onlyIDA totalIndiaIndonesiaIran, Islamic Rep.IraqIrelandIsraelItalyJamaicaJapanJordanKazakhstanKenyaKiribatiKorea, Dem. People’s Rep.Korea, Rep.KuwaitKyrgyz RepublicLao PDRLate-demographic dividendLatin America & Caribbean Latin America & Caribbean (excluding high income)Latin America & the Caribbean (IDA & IBRD countries)LatviaLeast developed countries: UN classificationLebanonLesothoLiberiaLibyaLiechtensteinLithuaniaLow & middle incomeLow incomeLower middle incomeLuxembourgMacao SAR, ChinaMacedonia, FYRMadagascarMalawiMaldivesMaliMaltaMarshall IslandsMauritaniaMauritiusMexicoMicronesia, Fed. Sts.Middle East & North AfricaMiddle East & North Africa (excluding high income)Middle East & North Africa (IDA & IBRD countries)Middle incomeMoldovaMongoliaMontenegroMoroccoMozambiqueMyanmarNamibiaNauruNepalNetherlandsNew ZealandNicaraguaNigerNigeriaNorth AmericaNorwayOECD membersOmanOther small statesPacific island small statesPakistanPanamaPapua New GuineaParaguayPeruPhilippinesPolandPortugalPost-demographic dividendPre-demographic dividendPuerto RicoQatarRomaniaRussian FederationRwandaSamoaSan MarinoSao Tome and PrincipeSaudi ArabiaSenegalSerbiaSeychellesSierra LeoneSloveniaSmall statesSolomon IslandsSomaliaSouth AfricaSouth AsiaSouth Asia (IDA & IBRD)South SudanSpainSri LankaSt. Kitts and NevisSt. LuciaSt. Vincent and the GrenadinesSub-Saharan Africa Sub-Saharan Africa (excluding high income)Sub-Saharan Africa (IDA & IBRD countries)SudanSurinameSwazilandSwedenSwitzerlandSyrian Arab RepublicTajikistanTanzaniaThailandTimor-LesteTogoTongaTrinidad and TobagoTunisiaTurkeyTuvaluUgandaUkraineUnited Arab EmiratesUnited KingdomUnited StatesUpper middle incomeUruguayUzbekistanVanuatuVenezuela, RBWest Bank and GazaWorldYemen, Rep.ZambiaZimbabwe Timeline:
This timeline shows a graph from 1972 to 2011 of Nicaragua. No data until 1971. Number of actual observations by date: 24.
Source name:
World Development Indicators
Source organization:
United Nations Educational, Scientific, and Cultural Organization (UNESCO) Institute for Statistics.
Categories, topics:
Education, Gender
Last updated:
apr 23, 2017
Indicators value changes by year
Minimum:
10.234K
jan 1, 2007
Maximum:
133.035K
jan 1, 1990
At the date of observation
Value
Absolute change
Change from previous value
jan 1, 1972
100.58K
+100.58K
0.0%
jan 1, 1974
103.351K
+2.771K
2.76%
jan 1, 1981
102.23K
-1.121K
-1.08%
jan 1, 1983
113.07K
+10.84K
10.6%
jan 1, 1984
115.867K
+2.797K
2.47%
jan 1, 1985
122.914K
+7.047K
6.08%
jan 1, 1986
117.4K
-5.514K
-4.49%
jan 1, 1987
123.603K
+6.203K
5.28%
jan 1, 1988
120.762K
-2.841K
-2.3%
jan 1, 1989
124.298K
+3.536K
2.93%
jan 1, 1990
133.035K
+8.737K
7.03%
jan 1, 1991
125.316K
-7.719K
-5.8%
jan 1, 1992
117.1K
-8.216K
-6.56%
jan 1, 1993
108.355K
-8.745K
-7.47%
jan 1, 1994
106.869K
-1.486K
-1.37%
jan 1, 1995
104.53K
-2.339K
-2.19%
jan 1, 1996
113.317K
+8.787K
8.41%
jan 1, 2000
75.78K
-37.537K
-33.13%
jan 1, 2001
63.065K
-12.715K
-16.78%
jan 1, 2002
45.118K
-17.947K
-28.46%
jan 1, 2003
14.272K
-30.846K
-68.37%
jan 1, 2007
10.234K
-4.038K
-28.29%
jan 1, 2008
11.474K
+1.24K
12.12%
jan 1, 2011
10.869K
-605.0
-5.27%
Ranking of countries by current statistics by years


Comments: