29
/
en
AIzaSyAYiBZKx7MnpbEhh9jyipgxe19OcubqV5w
April 1, 2024
171496
Kuwait
KWT
true
2
1
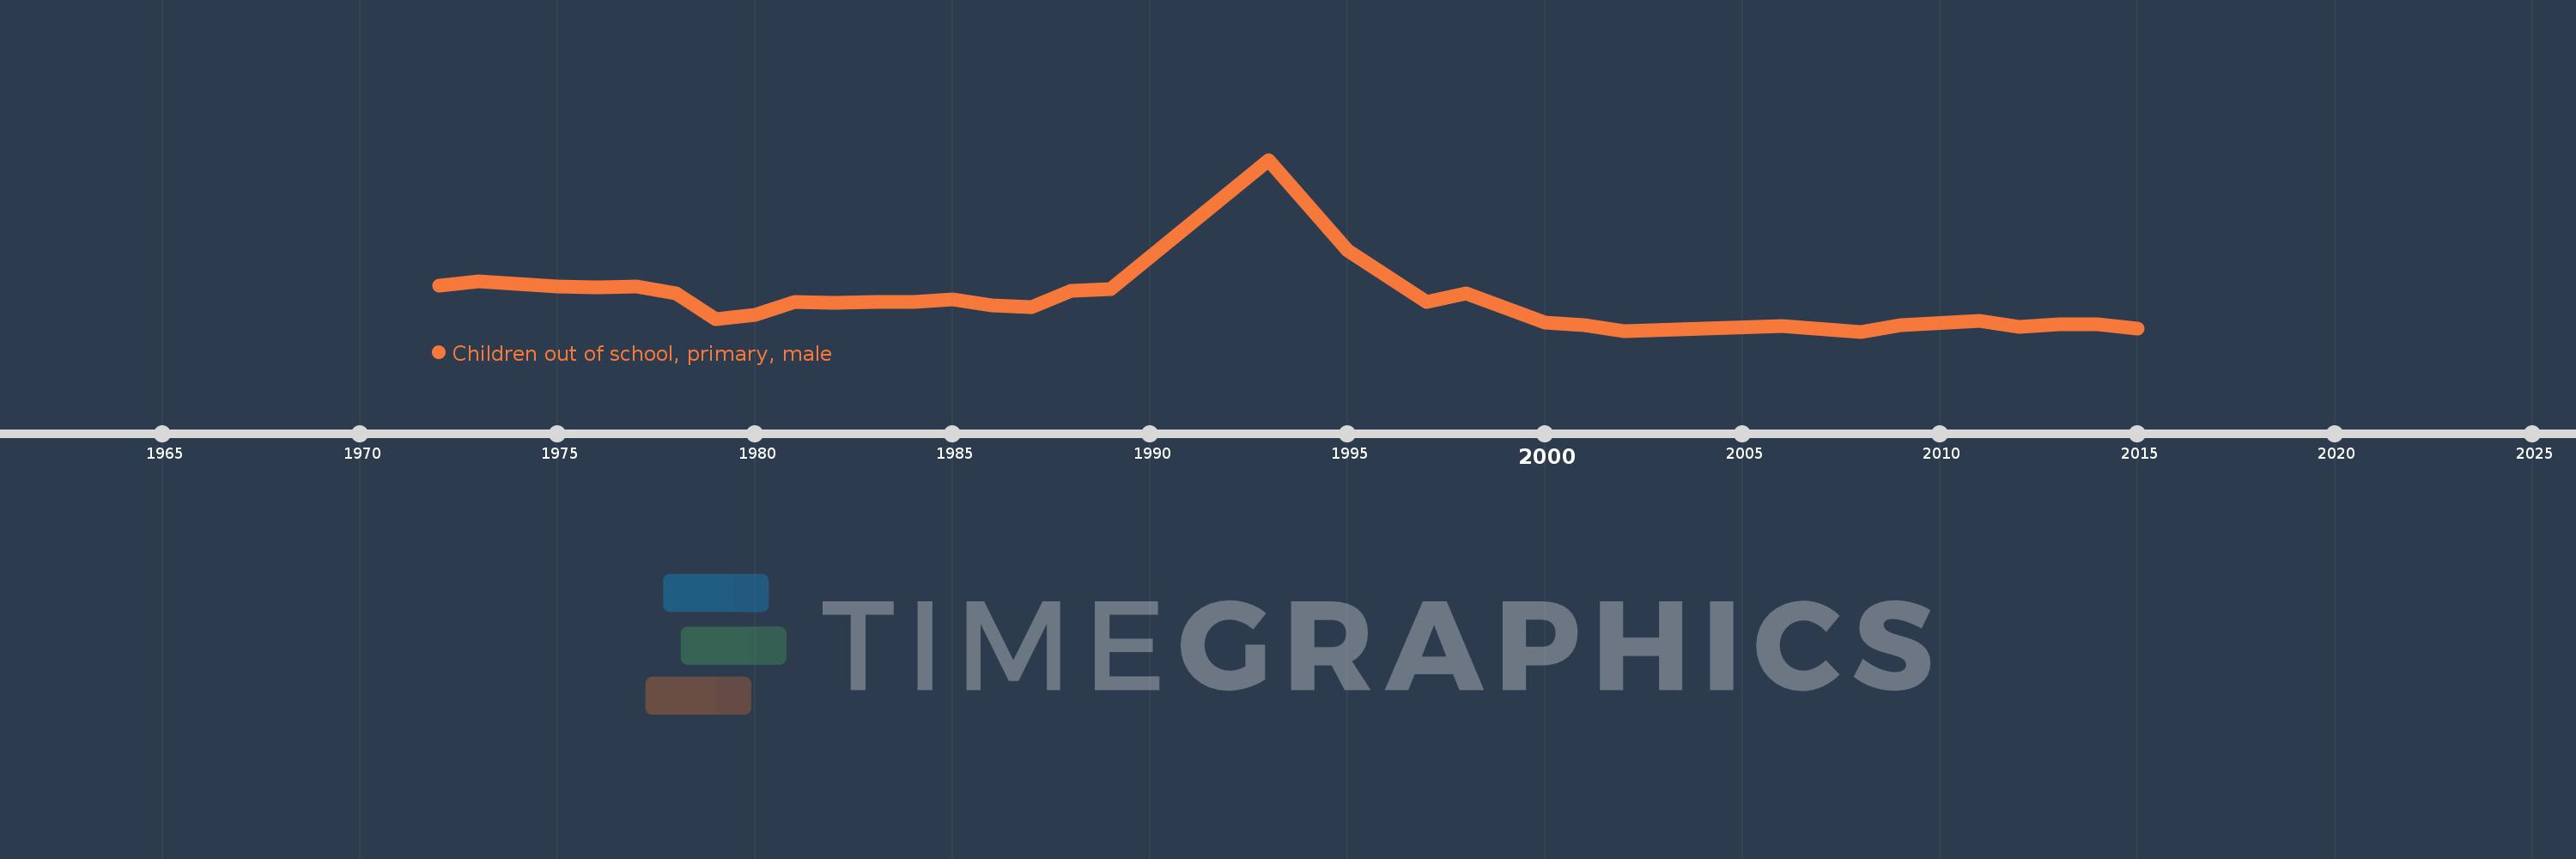
Children out of school, primary, male
2015,2014,2013,2012,2011,2009,2008,2006,2002,2001,2000,1998,1997,1995,1993,1989,1988,1987,1986,1985,1984,1983,1982,1981,1980,1979,1978,1977,1976,1975,1974,1973,1972
This statistics in other country:
AfghanistanAlbaniaAlgeriaAngolaAntigua and BarbudaArab WorldArgentinaArmeniaArubaAustraliaAustriaAzerbaijanBahamas, TheBahrainBangladeshBarbadosBelarusBelgiumBelizeBeninBermudaBhutanBoliviaBosnia and HerzegovinaBotswanaBrazilBrunei DarussalamBulgariaBurkina FasoBurundiCabo VerdeCambodiaCameroonCanadaCaribbean small statesCentral African RepublicCentral Europe and the BalticsChadChileChinaColombiaComorosCongo, Dem. Rep.Congo, Rep.Costa RicaCote d'IvoireCroatiaCubaCyprusDenmarkDjiboutiDominicaDominican RepublicEarly-demographic dividendEast Asia & PacificEast Asia & Pacific (excluding high income)East Asia & Pacific (IDA & IBRD countries)EcuadorEgypt, Arab Rep.El SalvadorEquatorial GuineaEritreaEstoniaEthiopiaEuro areaEurope & Central AsiaEurope & Central Asia (excluding high income)Europe & Central Asia (IDA & IBRD countries)European UnionFijiFinlandFragile and conflict affected situationsFranceGabonGambia, TheGeorgiaGhanaGreeceGrenadaGuatemalaGuineaGuinea-BissauGuyanaHaitiHeavily indebted poor countries (HIPC)High incomeHondurasHong Kong SAR, ChinaHungaryIBRD onlyIcelandIDA & IBRD totalIDA blendIDA onlyIDA totalIndiaIndonesiaIran, Islamic Rep.IraqIrelandIsraelItalyJamaicaJapanJordanKazakhstanKenyaKiribatiKorea, Dem. People’s Rep.Korea, Rep.KuwaitKyrgyz RepublicLao PDRLate-demographic dividendLatin America & Caribbean Latin America & Caribbean (excluding high income)Latin America & the Caribbean (IDA & IBRD countries)LatviaLeast developed countries: UN classificationLebanonLesothoLiberiaLibyaLiechtensteinLithuaniaLow & middle incomeLow incomeLower middle incomeLuxembourgMacao SAR, ChinaMacedonia, FYRMadagascarMalawiMaldivesMaliMaltaMarshall IslandsMauritaniaMauritiusMexicoMicronesia, Fed. Sts.Middle East & North AfricaMiddle East & North Africa (excluding high income)Middle East & North Africa (IDA & IBRD countries)Middle incomeMoldovaMongoliaMontenegroMoroccoMozambiqueMyanmarNamibiaNauruNepalNetherlandsNew ZealandNicaraguaNigerNigeriaNorth AmericaNorwayOECD membersOmanOther small statesPacific island small statesPakistanPanamaPapua New GuineaParaguayPeruPhilippinesPolandPortugalPost-demographic dividendPre-demographic dividendPuerto RicoQatarRomaniaRussian FederationRwandaSamoaSan MarinoSao Tome and PrincipeSaudi ArabiaSenegalSerbiaSeychellesSierra LeoneSloveniaSmall statesSolomon IslandsSomaliaSouth AfricaSouth AsiaSouth Asia (IDA & IBRD)South SudanSpainSri LankaSt. Kitts and NevisSt. LuciaSt. Vincent and the GrenadinesSub-Saharan Africa Sub-Saharan Africa (excluding high income)Sub-Saharan Africa (IDA & IBRD countries)SudanSurinameSwazilandSwedenSwitzerlandSyrian Arab RepublicTajikistanTanzaniaThailandTimor-LesteTogoTongaTrinidad and TobagoTunisiaTurkeyTuvaluUgandaUkraineUnited Arab EmiratesUnited KingdomUnited StatesUpper middle incomeUruguayUzbekistanVanuatuVenezuela, RBWest Bank and GazaWorldYemen, Rep.ZambiaZimbabwe Timeline:
This timeline shows a graph from 1972 to 2015 of Kuwait. No data until 1971. Number of actual observations by date: 33.
Source name:
World Development Indicators
Source organization:
United Nations Educational, Scientific, and Cultural Organization (UNESCO) Institute for Statistics.
Categories, topics:
Education, Gender
Last updated:
apr 23, 2017
Indicators value changes by year
Minimum:
1.658K
jan 1, 2008
Maximum:
49.113K
jan 1, 1993
At the date of observation
Value
Absolute change
Change from previous value
jan 1, 1972
14.261K
+14.261K
0.0%
jan 1, 1973
15.429K
+1.168K
8.19%
jan 1, 1974
14.709K
-720.0
-4.67%
jan 1, 1975
14.141K
-568.0
-3.86%
jan 1, 1976
13.883K
-258.0
-1.82%
jan 1, 1977
14.135K
+252.0
1.82%
jan 1, 1978
12.254K
-1.881K
-13.31%
jan 1, 1979
5.044K
-7.21K
-58.84%
jan 1, 1980
6.276K
+1.232K
24.43%
jan 1, 1981
9.757K
+3.481K
55.47%
jan 1, 1982
9.496K
-261.0
-2.68%
jan 1, 1983
9.827K
+331.0
3.49%
jan 1, 1984
9.918K
+91.0
0.93%
jan 1, 1985
10.563K
+645.0
6.5%
jan 1, 1986
8.914K
-1.649K
-15.61%
jan 1, 1987
8.427K
-487.0
-5.46%
jan 1, 1988
12.828K
+4.401K
52.22%
jan 1, 1989
13.462K
+634.0
4.94%
jan 1, 1993
49.113K
+35.651K
264.83%
jan 1, 1995
24.059K
-25.054K
-51.01%
jan 1, 1997
9.812K
-14.247K
-59.22%
jan 1, 1998
12.221K
+2.409K
24.55%
jan 1, 2000
4.189K
-8.032K
-65.72%
jan 1, 2001
3.356K
-833.0
-19.89%
jan 1, 2002
1.756K
-1.6K
-47.68%
jan 1, 2006
3.234K
+1.478K
84.17%
jan 1, 2008
1.658K
-1.576K
-48.73%
jan 1, 2009
3.423K
+1.765K
106.45%
jan 1, 2011
4.72K
+1.297K
37.89%
jan 1, 2012
2.854K
-1.866K
-39.53%
jan 1, 2013
3.733K
+879.0
30.8%
jan 1, 2014
3.602K
-131.0
-3.51%
jan 1, 2015
2.391K
-1.211K
-33.62%
Ranking of countries by current statistics by years


Comments: