30
/
AIzaSyAYiBZKx7MnpbEhh9jyipgxe19OcubqV5w
April 1, 2024
155698
Indonesia
IDN
true
2
1
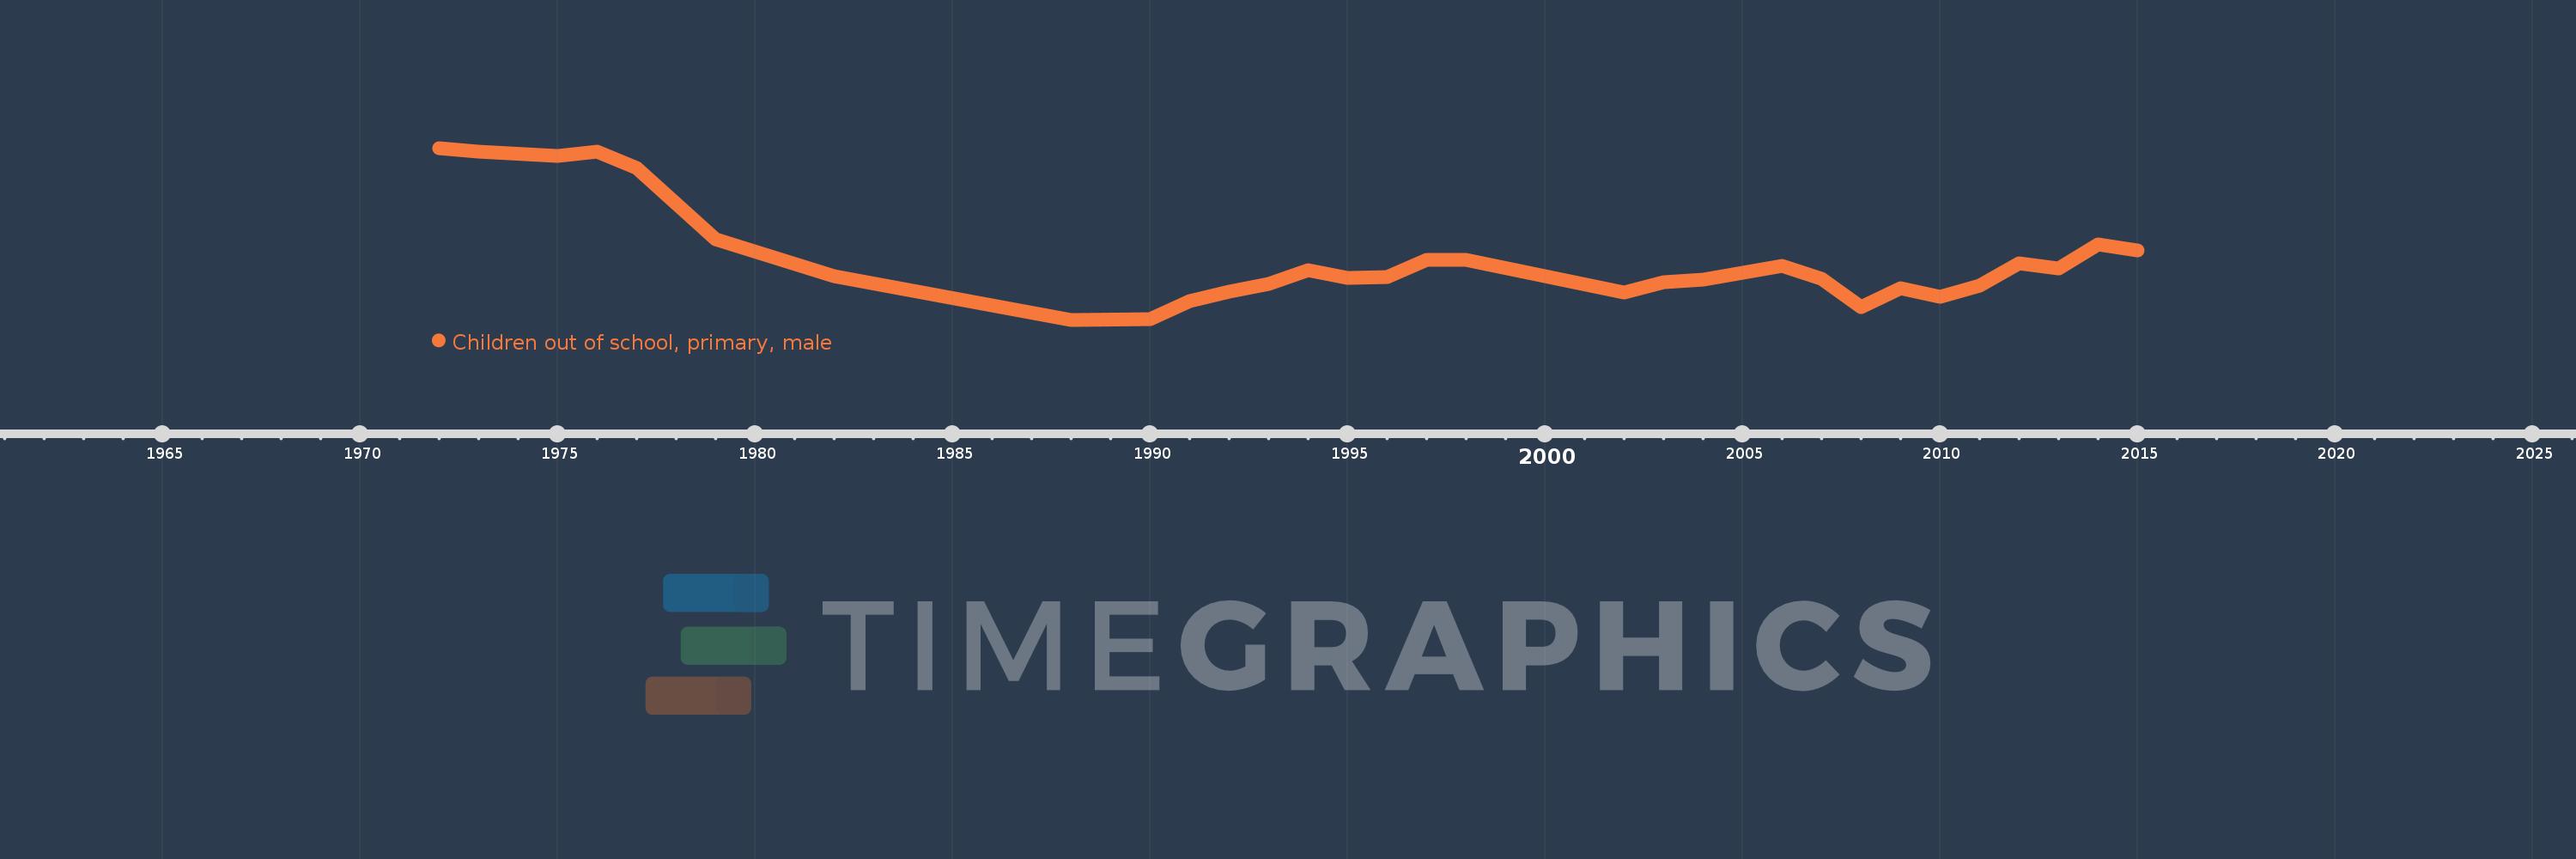
Children out of school, primary, male
2015,2014,2013,2012,2011,2010,2009,2008,2007,2006,2004,2003,2002,1998,1997,1996,1995,1994,1993,1992,1991,1990,1988,1982,1979,1977,1976,1975,1973,1972
