29
/
en
AIzaSyAYiBZKx7MnpbEhh9jyipgxe19OcubqV5w
April 1, 2024
62431
World
WLD
false
2
1
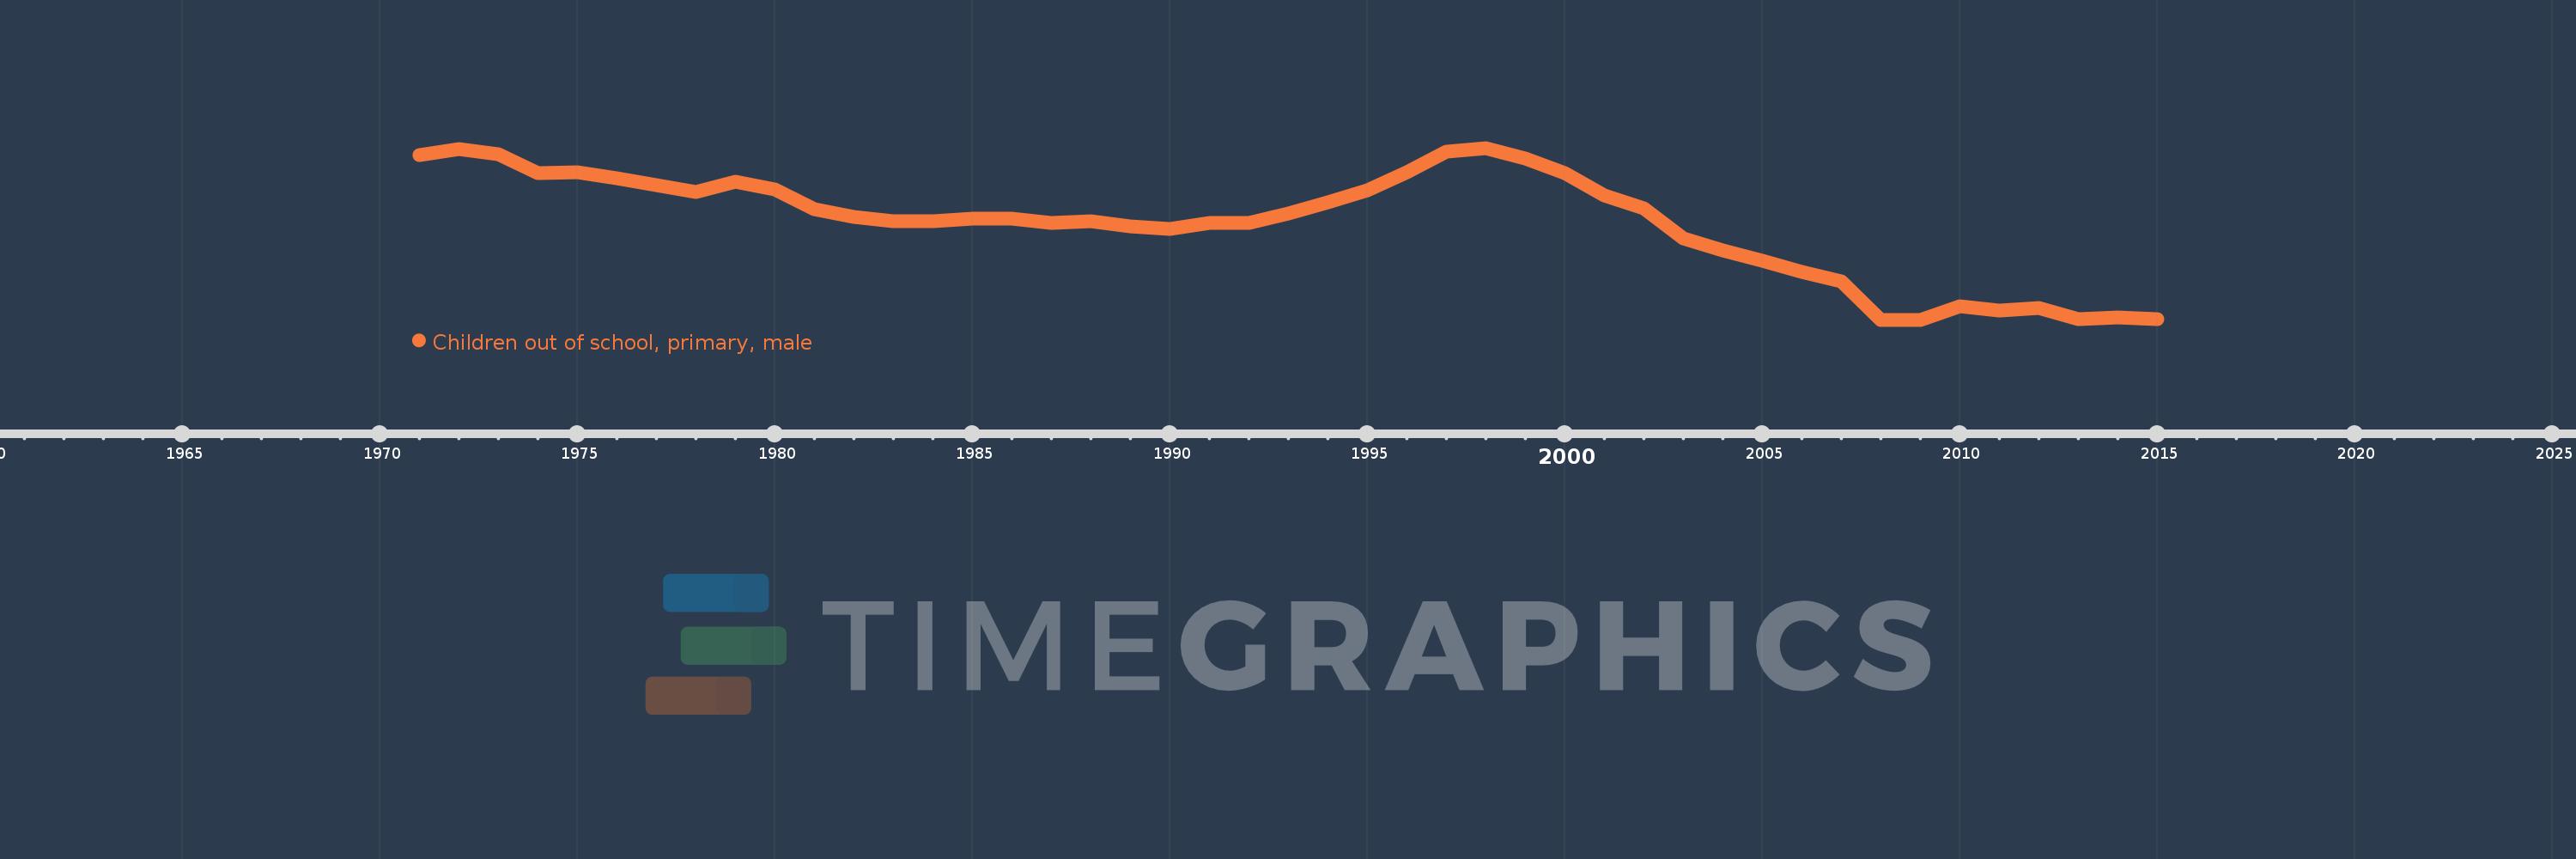
Children out of school, primary, male
2015,2014,2013,2012,2011,2010,2009,2008,2007,2006,2005,2004,2003,2002,2001,2000,1999,1998,1997,1996,1995,1994,1993,1992,1991,1990,1989,1988,1987,1986,1985,1984,1983,1982,1981,1980,1979,1978,1977,1976,1975,1974,1973,1972,1971
This statistics in other country:
AfghanistanAlbaniaAlgeriaAngolaAntigua and BarbudaArab WorldArgentinaArmeniaArubaAustraliaAustriaAzerbaijanBahamas, TheBahrainBangladeshBarbadosBelarusBelgiumBelizeBeninBermudaBhutanBoliviaBosnia and HerzegovinaBotswanaBrazilBrunei DarussalamBulgariaBurkina FasoBurundiCabo VerdeCambodiaCameroonCanadaCaribbean small statesCentral African RepublicCentral Europe and the BalticsChadChileChinaColombiaComorosCongo, Dem. Rep.Congo, Rep.Costa RicaCote d'IvoireCroatiaCubaCyprusDenmarkDjiboutiDominicaDominican RepublicEarly-demographic dividendEast Asia & PacificEast Asia & Pacific (excluding high income)East Asia & Pacific (IDA & IBRD countries)EcuadorEgypt, Arab Rep.El SalvadorEquatorial GuineaEritreaEstoniaEthiopiaEuro areaEurope & Central AsiaEurope & Central Asia (excluding high income)Europe & Central Asia (IDA & IBRD countries)European UnionFijiFinlandFragile and conflict affected situationsFranceGabonGambia, TheGeorgiaGhanaGreeceGrenadaGuatemalaGuineaGuinea-BissauGuyanaHaitiHeavily indebted poor countries (HIPC)High incomeHondurasHong Kong SAR, ChinaHungaryIBRD onlyIcelandIDA & IBRD totalIDA blendIDA onlyIDA totalIndiaIndonesiaIran, Islamic Rep.IraqIrelandIsraelItalyJamaicaJapanJordanKazakhstanKenyaKiribatiKorea, Dem. People’s Rep.Korea, Rep.KuwaitKyrgyz RepublicLao PDRLate-demographic dividendLatin America & Caribbean Latin America & Caribbean (excluding high income)Latin America & the Caribbean (IDA & IBRD countries)LatviaLeast developed countries: UN classificationLebanonLesothoLiberiaLibyaLiechtensteinLithuaniaLow & middle incomeLow incomeLower middle incomeLuxembourgMacao SAR, ChinaMacedonia, FYRMadagascarMalawiMaldivesMaliMaltaMarshall IslandsMauritaniaMauritiusMexicoMicronesia, Fed. Sts.Middle East & North AfricaMiddle East & North Africa (excluding high income)Middle East & North Africa (IDA & IBRD countries)Middle incomeMoldovaMongoliaMontenegroMoroccoMozambiqueMyanmarNamibiaNauruNepalNetherlandsNew ZealandNicaraguaNigerNigeriaNorth AmericaNorwayOECD membersOmanOther small statesPacific island small statesPakistanPanamaPapua New GuineaParaguayPeruPhilippinesPolandPortugalPost-demographic dividendPre-demographic dividendPuerto RicoQatarRomaniaRussian FederationRwandaSamoaSan MarinoSao Tome and PrincipeSaudi ArabiaSenegalSerbiaSeychellesSierra LeoneSloveniaSmall statesSolomon IslandsSomaliaSouth AfricaSouth AsiaSouth Asia (IDA & IBRD)South SudanSpainSri LankaSt. Kitts and NevisSt. LuciaSt. Vincent and the GrenadinesSub-Saharan Africa Sub-Saharan Africa (excluding high income)Sub-Saharan Africa (IDA & IBRD countries)SudanSurinameSwazilandSwedenSwitzerlandSyrian Arab RepublicTajikistanTanzaniaThailandTimor-LesteTogoTongaTrinidad and TobagoTunisiaTurkeyTuvaluUgandaUkraineUnited Arab EmiratesUnited KingdomUnited StatesUpper middle incomeUruguayUzbekistanVanuatuVenezuela, RBWest Bank and GazaWorldYemen, Rep.ZambiaZimbabwe Timeline:
This timeline shows a graph from 1971 to 2015 of World. No data until 1970. Number of actual observations by date: 45.
Source name:
World Development Indicators
Source organization:
United Nations Educational, Scientific, and Cultural Organization (UNESCO) Institute for Statistics.
Categories, topics:
Education, Gender
Last updated:
apr 23, 2017
Indicators value changes by year
Minimum:
28.792 mln
jan 1, 2009
Maximum:
47.369 mln
jan 1, 1998
At the date of observation
Value
Absolute change
Change from previous value
jan 1, 1971
46.576 mln
+46.576 mln
0.0%
jan 1, 1972
47.216 mln
+640.244K
1.37%
jan 1, 1973
46.658 mln
-558.216K
-1.18%
jan 1, 1974
44.68 mln
-1.978 mln
-4.24%
jan 1, 1975
44.768 mln
+87.716K
0.2%
jan 1, 1976
44.06 mln
-707.744K
-1.58%
jan 1, 1977
43.333 mln
-726.692K
-1.65%
jan 1, 1978
42.605 mln
-728.708K
-1.68%
jan 1, 1979
43.723 mln
+1.118 mln
2.63%
jan 1, 1980
42.916 mln
-807.12K
-1.85%
jan 1, 1981
40.776 mln
-2.14 mln
-4.99%
jan 1, 1982
39.911 mln
-865.72K
-2.12%
jan 1, 1983
39.415 mln
-495.768K
-1.24%
jan 1, 1984
39.425 mln
+9.68K
0.02%
jan 1, 1985
39.732 mln
+307.644K
0.78%
jan 1, 1986
39.749 mln
+16.708K
0.04%
jan 1, 1987
39.282 mln
-467.008K
-1.17%
jan 1, 1988
39.416 mln
+134.34K
0.34%
jan 1, 1989
38.931 mln
-485.588K
-1.23%
jan 1, 1990
38.63 mln
-301.04K
-0.77%
jan 1, 1991
39.215 mln
+585.784K
1.52%
jan 1, 1992
39.293 mln
+77.896K
0.2%
jan 1, 1993
40.247 mln
+953.312K
2.43%
jan 1, 1994
41.461 mln
+1.215 mln
3.02%
jan 1, 1995
42.758 mln
+1.297 mln
3.13%
jan 1, 1996
44.751 mln
+1.992 mln
4.66%
jan 1, 1997
47.01 mln
+2.259 mln
5.05%
jan 1, 1998
47.369 mln
+359.224K
0.76%
jan 1, 1999
46.238 mln
-1.131 mln
-2.39%
jan 1, 2000
44.675 mln
-1.563 mln
-3.38%
jan 1, 2001
42.259 mln
-2.417 mln
-5.41%
jan 1, 2002
40.811 mln
-1.447 mln
-3.43%
jan 1, 2003
37.59 mln
-3.221 mln
-7.89%
jan 1, 2004
36.246 mln
-1.344 mln
-3.58%
jan 1, 2005
35.17 mln
-1.076 mln
-2.97%
jan 1, 2006
33.968 mln
-1.202 mln
-3.42%
jan 1, 2007
32.919 mln
-1.048 mln
-3.09%
jan 1, 2008
28.805 mln
-4.114 mln
-12.5%
jan 1, 2009
28.792 mln
-13.708K
-0.05%
jan 1, 2010
30.274 mln
+1.482 mln
5.15%
jan 1, 2011
29.758 mln
-515.514K
-1.7%
jan 1, 2012
30.033 mln
+274.58K
0.92%
jan 1, 2013
28.813 mln
-1.219 mln
-4.06%
jan 1, 2014
29.08 mln
+266.308K
0.92%
jan 1, 2015
28.879 mln
-200.392K
-0.69%
Ranking of countries by current statistics by years


Comments: