29
/
en
AIzaSyAYiBZKx7MnpbEhh9jyipgxe19OcubqV5w
April 1, 2024
159205
Ireland
IRL
true
2
1
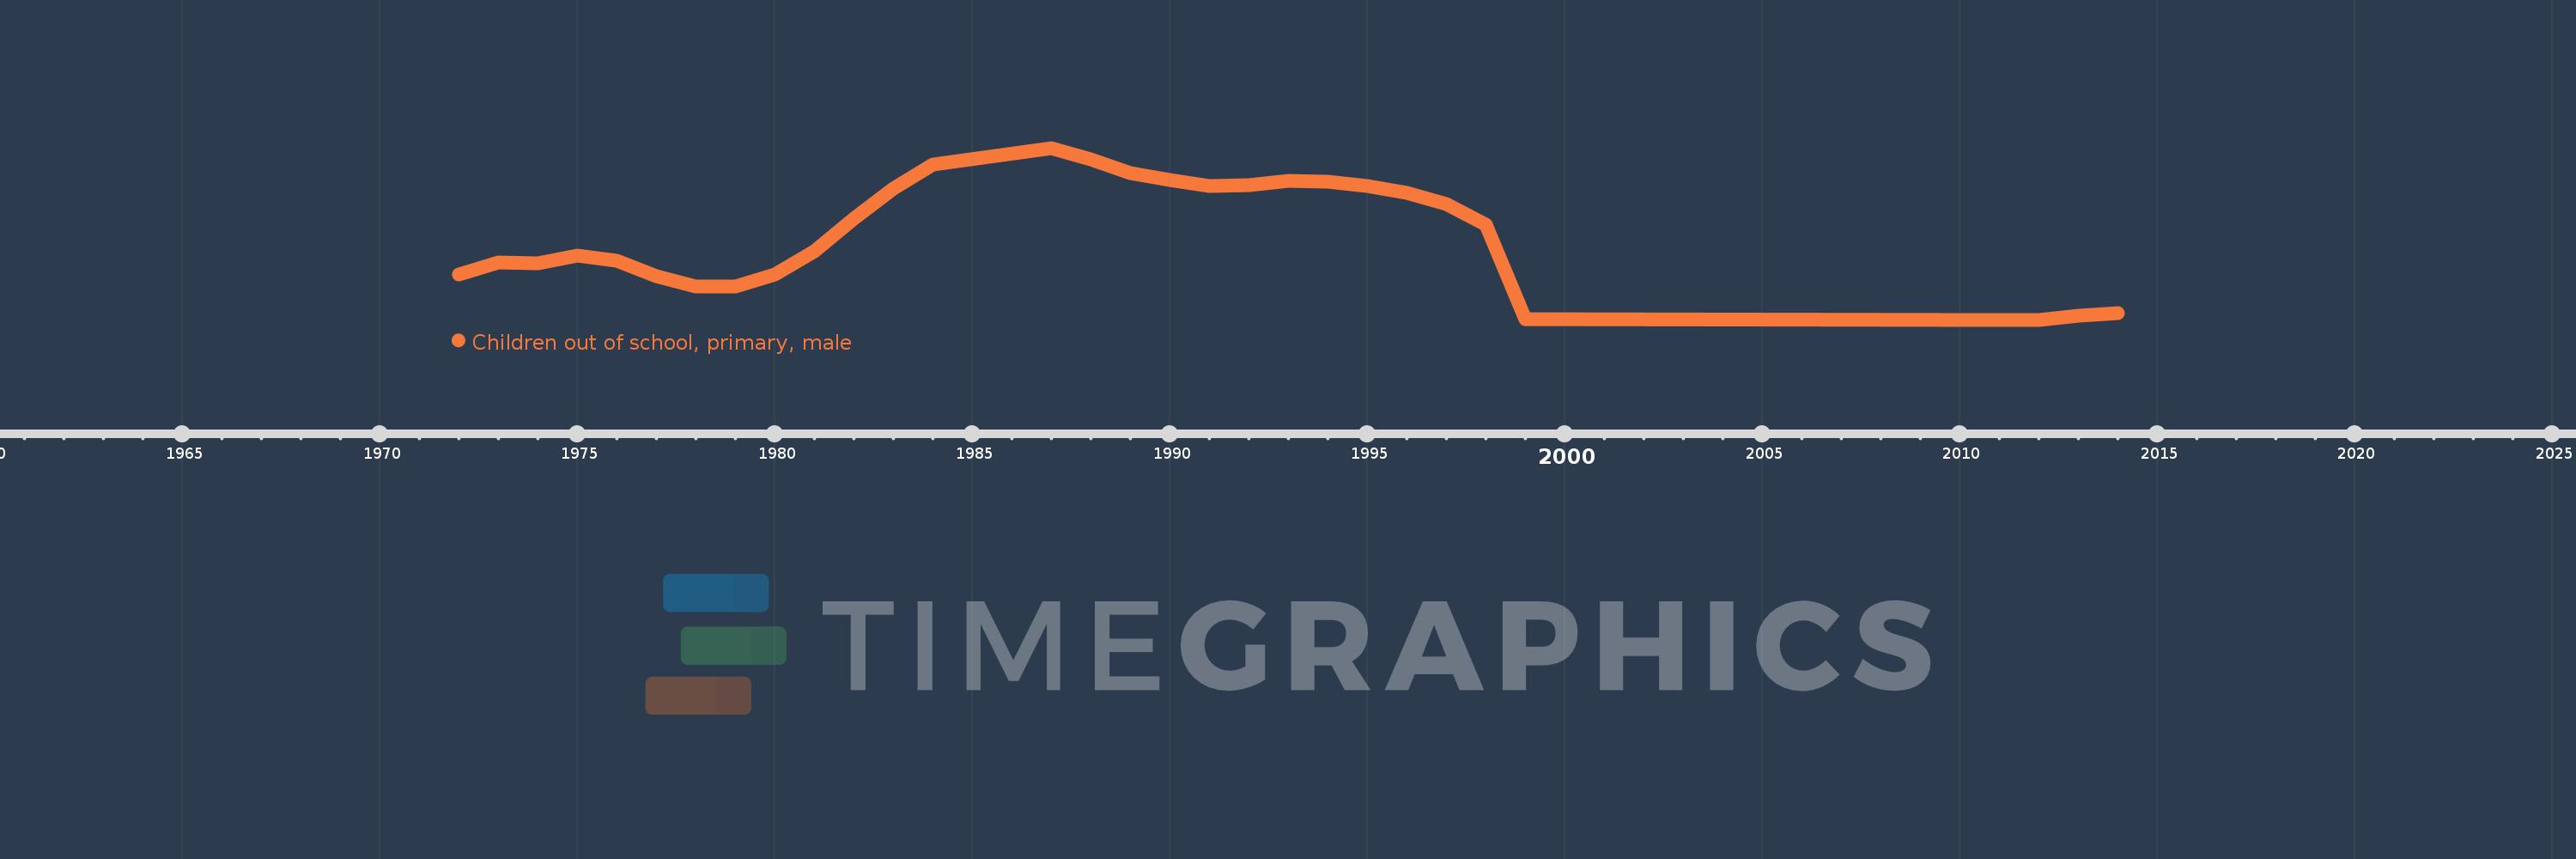
Children out of school, primary, male
2014,2013,2012,2011,1999,1998,1997,1996,1995,1994,1993,1992,1991,1990,1989,1988,1987,1984,1983,1982,1981,1980,1979,1978,1977,1976,1975,1974,1973,1972
This statistics in other country:
AfghanistanAlbaniaAlgeriaAngolaAntigua and BarbudaArab WorldArgentinaArmeniaArubaAustraliaAustriaAzerbaijanBahamas, TheBahrainBangladeshBarbadosBelarusBelgiumBelizeBeninBermudaBhutanBoliviaBosnia and HerzegovinaBotswanaBrazilBrunei DarussalamBulgariaBurkina FasoBurundiCabo VerdeCambodiaCameroonCanadaCaribbean small statesCentral African RepublicCentral Europe and the BalticsChadChileChinaColombiaComorosCongo, Dem. Rep.Congo, Rep.Costa RicaCote d'IvoireCroatiaCubaCyprusDenmarkDjiboutiDominicaDominican RepublicEarly-demographic dividendEast Asia & PacificEast Asia & Pacific (excluding high income)East Asia & Pacific (IDA & IBRD countries)EcuadorEgypt, Arab Rep.El SalvadorEquatorial GuineaEritreaEstoniaEthiopiaEuro areaEurope & Central AsiaEurope & Central Asia (excluding high income)Europe & Central Asia (IDA & IBRD countries)European UnionFijiFinlandFragile and conflict affected situationsFranceGabonGambia, TheGeorgiaGhanaGreeceGrenadaGuatemalaGuineaGuinea-BissauGuyanaHaitiHeavily indebted poor countries (HIPC)High incomeHondurasHong Kong SAR, ChinaHungaryIBRD onlyIcelandIDA & IBRD totalIDA blendIDA onlyIDA totalIndiaIndonesiaIran, Islamic Rep.IraqIrelandIsraelItalyJamaicaJapanJordanKazakhstanKenyaKiribatiKorea, Dem. People’s Rep.Korea, Rep.KuwaitKyrgyz RepublicLao PDRLate-demographic dividendLatin America & Caribbean Latin America & Caribbean (excluding high income)Latin America & the Caribbean (IDA & IBRD countries)LatviaLeast developed countries: UN classificationLebanonLesothoLiberiaLibyaLiechtensteinLithuaniaLow & middle incomeLow incomeLower middle incomeLuxembourgMacao SAR, ChinaMacedonia, FYRMadagascarMalawiMaldivesMaliMaltaMarshall IslandsMauritaniaMauritiusMexicoMicronesia, Fed. Sts.Middle East & North AfricaMiddle East & North Africa (excluding high income)Middle East & North Africa (IDA & IBRD countries)Middle incomeMoldovaMongoliaMontenegroMoroccoMozambiqueMyanmarNamibiaNauruNepalNetherlandsNew ZealandNicaraguaNigerNigeriaNorth AmericaNorwayOECD membersOmanOther small statesPacific island small statesPakistanPanamaPapua New GuineaParaguayPeruPhilippinesPolandPortugalPost-demographic dividendPre-demographic dividendPuerto RicoQatarRomaniaRussian FederationRwandaSamoaSan MarinoSao Tome and PrincipeSaudi ArabiaSenegalSerbiaSeychellesSierra LeoneSloveniaSmall statesSolomon IslandsSomaliaSouth AfricaSouth AsiaSouth Asia (IDA & IBRD)South SudanSpainSri LankaSt. Kitts and NevisSt. LuciaSt. Vincent and the GrenadinesSub-Saharan Africa Sub-Saharan Africa (excluding high income)Sub-Saharan Africa (IDA & IBRD countries)SudanSurinameSwazilandSwedenSwitzerlandSyrian Arab RepublicTajikistanTanzaniaThailandTimor-LesteTogoTongaTrinidad and TobagoTunisiaTurkeyTuvaluUgandaUkraineUnited Arab EmiratesUnited KingdomUnited StatesUpper middle incomeUruguayUzbekistanVanuatuVenezuela, RBWest Bank and GazaWorldYemen, Rep.ZambiaZimbabwe Timeline:
This timeline shows a graph from 1972 to 2014 of Ireland. No data until 1971. Number of actual observations by date: 30.
Source name:
World Development Indicators
Source organization:
United Nations Educational, Scientific, and Cultural Organization (UNESCO) Institute for Statistics.
Categories, topics:
Education, Gender
Last updated:
apr 23, 2017
Indicators value changes by year
Minimum:
1.559K
jan 1, 2011
Maximum:
35.982K
jan 1, 1987
At the date of observation
Value
Absolute change
Change from previous value
jan 1, 1972
10.711K
+10.711K
0.0%
jan 1, 1973
13.023K
+2.312K
21.59%
jan 1, 1974
12.95K
-73.0
-0.56%
jan 1, 1975
14.343K
+1.393K
10.76%
jan 1, 1976
13.318K
-1.025K
-7.15%
jan 1, 1977
10.332K
-2.986K
-22.42%
jan 1, 1978
8.165K
-2.167K
-20.97%
jan 1, 1979
8.164K
-1.0
-0.01%
jan 1, 1980
10.622K
+2.458K
30.11%
jan 1, 1981
15.244K
+4.622K
43.51%
jan 1, 1982
21.791K
+6.547K
42.95%
jan 1, 1983
27.83K
+6.039K
27.71%
jan 1, 1984
32.597K
+4.767K
17.13%
jan 1, 1987
35.982K
+3.385K
10.38%
jan 1, 1988
33.74K
-2.242K
-6.23%
jan 1, 1989
30.998K
-2.742K
-8.13%
jan 1, 1990
29.575K
-1.423K
-4.59%
jan 1, 1991
28.312K
-1.263K
-4.27%
jan 1, 1992
28.481K
+169.0
0.6%
jan 1, 1993
29.379K
+898.0
3.15%
jan 1, 1994
29.279K
-100.0
-0.34%
jan 1, 1995
28.363K
-916.0
-3.13%
jan 1, 1996
26.962K
-1.401K
-4.94%
jan 1, 1997
24.657K
-2.305K
-8.55%
jan 1, 1998
20.687K
-3.97K
-16.1%
jan 1, 1999
1.618K
-19.069K
-92.18%
jan 1, 2011
1.559K
-59.0
-3.65%
jan 1, 2012
1.583K
+24.0
1.54%
jan 1, 2013
2.393K
+810.0
51.17%
jan 1, 2014
2.926K
+533.0
22.27%
Ranking of countries by current statistics by years


Comments: