29
/
en
AIzaSyAYiBZKx7MnpbEhh9jyipgxe19OcubqV5w
April 1, 2024
184770
Madagascar
MDG
true
2
1
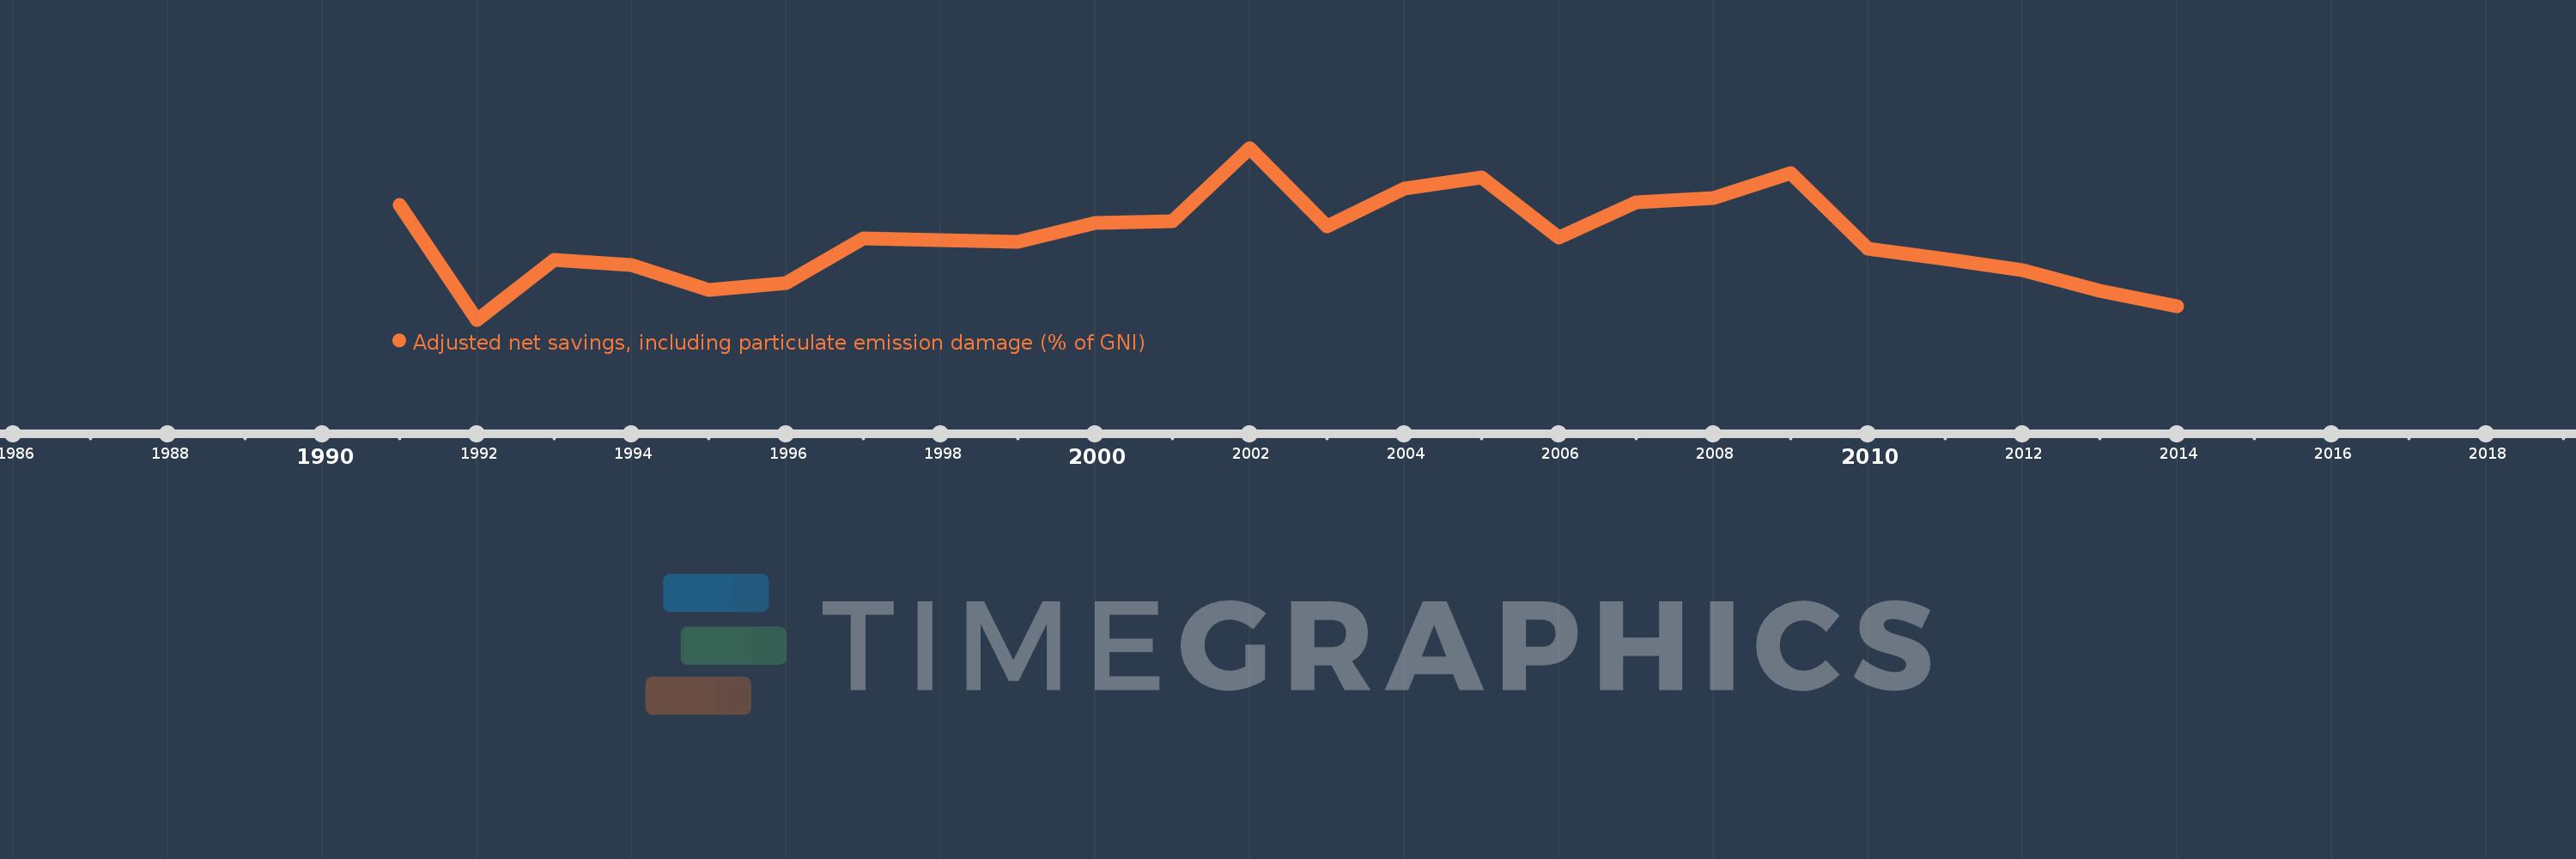
Adjusted net savings, including particulate emission damage (% of GNI)
2014,2013,2012,2011,2010,2009,2008,2007,2006,2005,2004,2003,2002,2001,2000,1999,1998,1997,1996,1995,1994,1993,1992,1991
This statistics in other country:
AfghanistanAlbaniaAlgeriaAngolaArab WorldArgentinaArmeniaAustraliaAustriaAzerbaijanBahamas, TheBahrainBangladeshBarbadosBelarusBelgiumBelizeBeninBhutanBoliviaBotswanaBrazilBrunei DarussalamBulgariaBurkina FasoBurundiCabo VerdeCambodiaCameroonCanadaCaribbean small statesCentral African RepublicCentral Europe and the BalticsChadChileChinaColombiaComorosCongo, Dem. Rep.Congo, Rep.Costa RicaCote d'IvoireCroatiaCyprusCzech RepublicDenmarkDominican RepublicEarly-demographic dividendEast Asia & PacificEast Asia & Pacific (excluding high income)East Asia & Pacific (IDA & IBRD countries)EcuadorEgypt, Arab Rep.El SalvadorEquatorial GuineaEritreaEstoniaEthiopiaEuro areaEurope & Central AsiaEurope & Central Asia (excluding high income)Europe & Central Asia (IDA & IBRD countries)European UnionFijiFinlandFragile and conflict affected situationsFranceGabonGambia, TheGeorgiaGermanyGhanaGreeceGuatemalaGuineaGuinea-BissauGuyanaHaitiHeavily indebted poor countries (HIPC)High incomeHondurasHungaryIBRD onlyIcelandIDA & IBRD totalIDA blendIDA onlyIDA totalIndiaIndonesiaIran, Islamic Rep.IraqIrelandIsraelItalyJamaicaJapanJordanKazakhstanKenyaKorea, Rep.KuwaitKyrgyz RepublicLao PDRLate-demographic dividendLatin America & Caribbean Latin America & Caribbean (excluding high income)Latin America & the Caribbean (IDA & IBRD countries)LatviaLeast developed countries: UN classificationLebanonLesothoLiberiaLibyaLithuaniaLow & middle incomeLow incomeLower middle incomeLuxembourgMacedonia, FYRMadagascarMalawiMalaysiaMaldivesMaliMauritaniaMauritiusMexicoMiddle East & North AfricaMiddle East & North Africa (excluding high income)Middle East & North Africa (IDA & IBRD countries)Middle incomeMoldovaMongoliaMoroccoMozambiqueNamibiaNepalNetherlandsNew ZealandNicaraguaNigerNigeriaNorth AmericaNorwayOECD membersOmanOther small statesPacific island small statesPakistanPanamaPapua New GuineaParaguayPeruPhilippinesPolandPortugalPost-demographic dividendPre-demographic dividendQatarRomaniaRussian FederationRwandaSaudi ArabiaSenegalSierra LeoneSingaporeSlovak RepublicSloveniaSmall statesSolomon IslandsSouth AfricaSouth AsiaSouth Asia (IDA & IBRD)SpainSri LankaSub-Saharan Africa Sub-Saharan Africa (excluding high income)Sub-Saharan Africa (IDA & IBRD countries)SudanSurinameSwazilandSwedenSwitzerlandSyrian Arab RepublicTajikistanTanzaniaThailandTogoTrinidad and TobagoTunisiaTurkeyUgandaUkraineUnited KingdomUnited StatesUpper middle incomeUruguayVenezuela, RBVietnamWorldYemen, Rep.ZambiaZimbabwe Timeline:
This timeline shows a graph from 1991 to 2014 of Madagascar. No data until 1990. Number of actual observations by date: 24.
Source name:
World Development Indicators
Source organization:
World Bank staff estimates based on sources and methods in World Bank's "The Changing Wealth of Nations: Measuring Sustainable Development in the New Millennium" (2011).
Categories, topics:
Economy & Growth, Environment
Last updated:
apr 23, 2017
Indicators value changes by year
Minimum:
-6.894
jan 1, 1992
Maximum:
13.622
jan 1, 2002
At the date of observation
Value
Absolute change
Change from previous value
jan 1, 1991
6.845
+6.845
0.0%
jan 1, 1992
-6.894
-13.738
-200.72%
jan 1, 1993
0.231
+7.125
-103.35%
jan 1, 1994
-0.409
-0.64
-277.24%
jan 1, 1995
-3.339
-2.929
715.86%
jan 1, 1996
-2.53
+0.809
-24.23%
jan 1, 1997
2.855
+5.385
-212.87%
jan 1, 1998
2.604
-0.252
-8.81%
jan 1, 1999
2.443
-0.16
-6.15%
jan 1, 2000
4.684
+2.24
91.68%
jan 1, 2001
4.875
+0.192
4.09%
jan 1, 2002
13.622
+8.747
179.4%
jan 1, 2003
4.236
-9.386
-68.9%
jan 1, 2004
8.808
+4.572
107.93%
jan 1, 2005
10.07
+1.263
14.33%
jan 1, 2006
2.907
-7.164
-71.14%
jan 1, 2007
7.083
+4.176
143.67%
jan 1, 2008
7.663
+0.58
8.19%
jan 1, 2009
10.577
+2.913
38.02%
jan 1, 2010
1.561
-9.015
-85.24%
jan 1, 2011
0.366
-1.195
-76.56%
jan 1, 2012
-0.93
-1.296
-354.25%
jan 1, 2013
-3.419
-2.488
267.45%
jan 1, 2014
-5.264
-1.846
53.99%
Ranking of countries by current statistics by years


Comments: