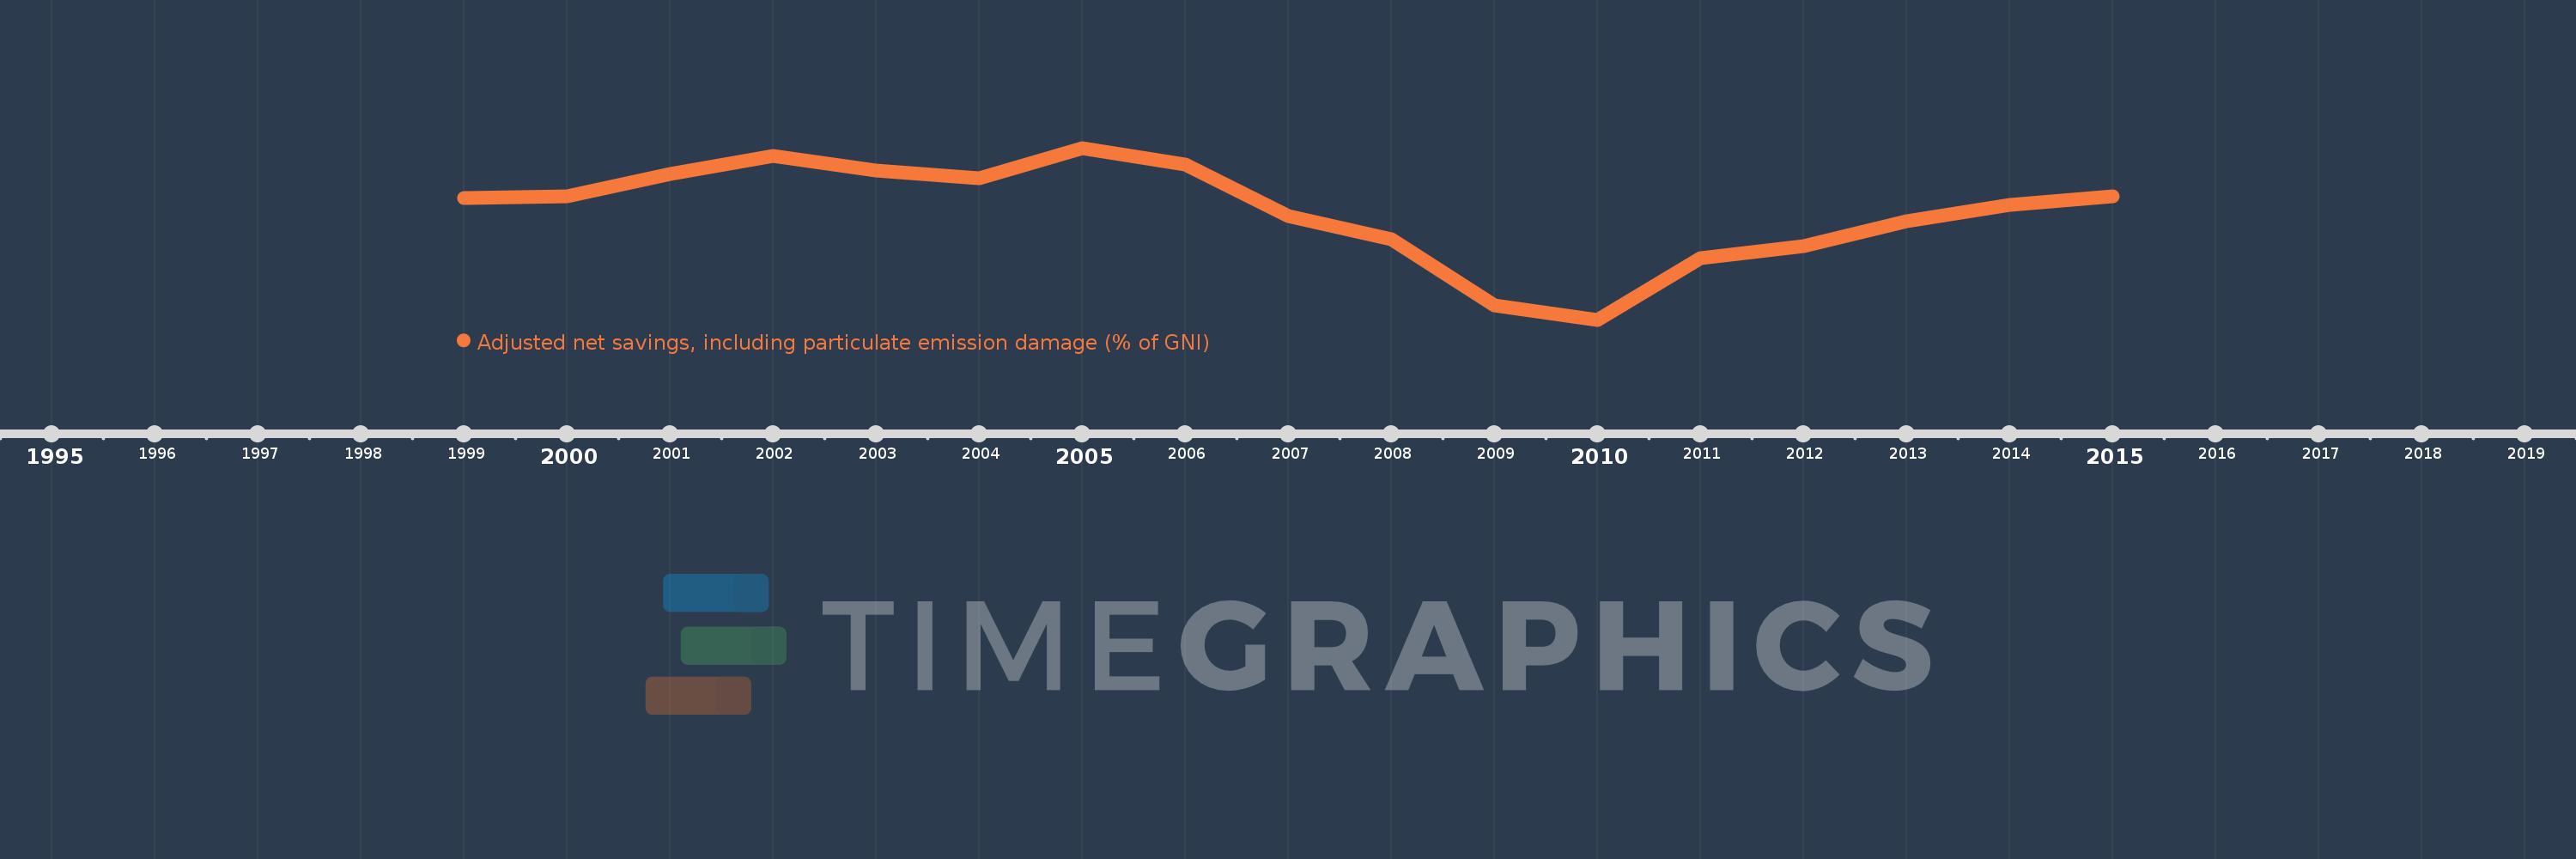
This timeline shows a graph from 1999 to 2015 of Georgia. No data until 1998. Number of actual observations by date: 17.
Source name:
World Development Indicators
Source organization:
World Bank staff estimates based on sources and methods in World Bank's "The Changing Wealth of Nations: Measuring Sustainable Development in the New Millennium" (2011).
Categories, topics:
Economy & Growth, Environment
Last updated:
apr 23, 2017
Indicators value changes by year
Meaning:
7.35
Minimum:
-7.034
jan 1, 2010
Maximum:
15.759
jan 1, 2005
At the date of observation
Value
Absolute change
Change from the previous value
jan 1, 1999
9.116
+9.116
0.0%
jan 1, 2000
9.337
+0.222
2.43%
jan 1, 2001
12.314
+2.976
31.88%
jan 1, 2002
14.694
+2.38
19.33%
jan 1, 2003
12.766
-1.928
-13.12%
jan 1, 2004
11.751
-1.015
-7.95%
jan 1, 2005
15.759
+4.008
34.11%
jan 1, 2006
13.515
-2.244
-14.24%
jan 1, 2007
6.701
-6.814
-50.42%
jan 1, 2008
3.681
-3.02
-45.06%
jan 1, 2009
-5.092
-8.773
-238.31%
jan 1, 2010
-7.034
-1.943
38.16%
jan 1, 2011
1.104
+8.139
-115.7%
jan 1, 2012
2.753
+1.649
149.33%
jan 1, 2013
5.992
+3.238
117.63%
jan 1, 2014
8.24
+2.248
37.52%
jan 1, 2015
9.359
+1.12
13.59%
Ranking of countries by current statistics by years
