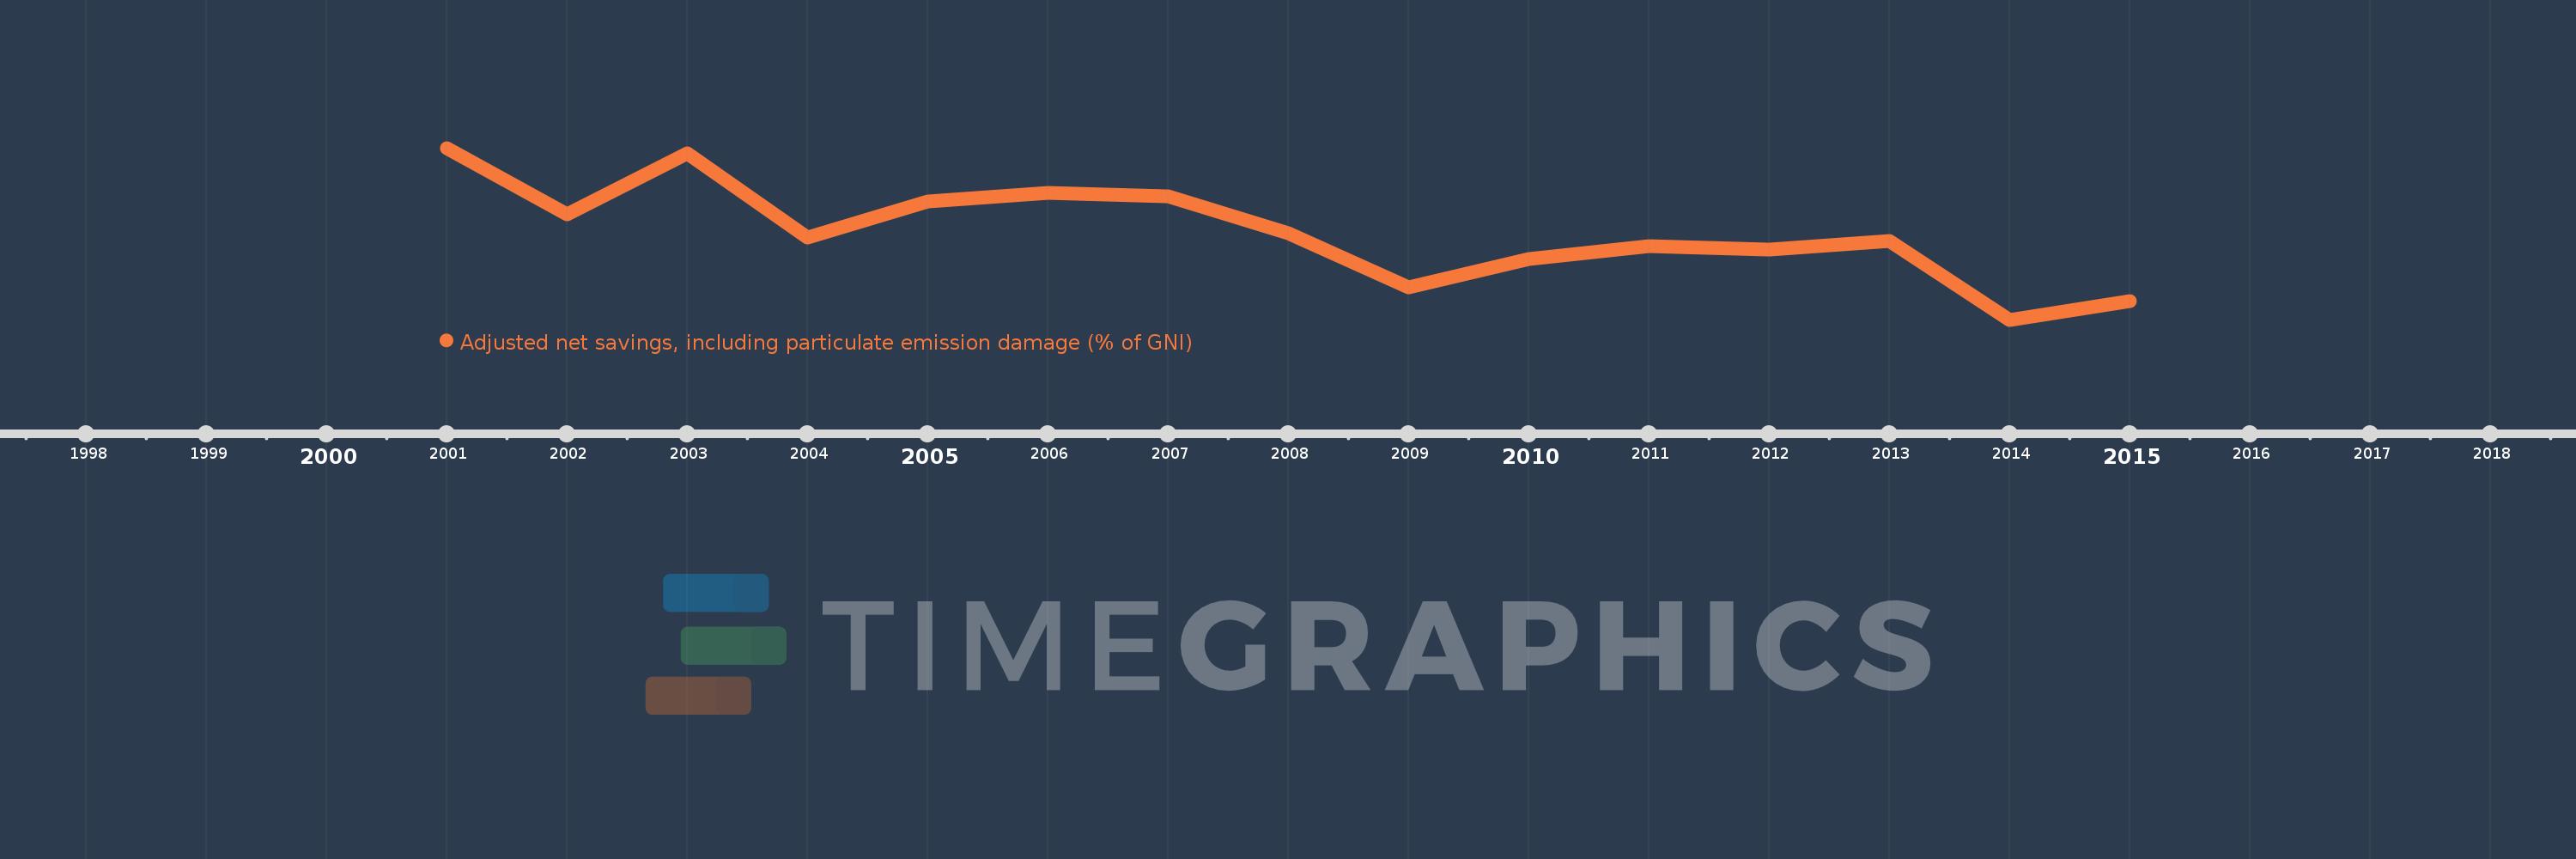
This timeline shows a graph from 2001 to 2015 of Congo, Dem. Rep.. No data until 2000. Number of actual observations by date: 15.
Source name:
World Development Indicators
Source organization:
World Bank staff estimates based on sources and methods in World Bank's "The Changing Wealth of Nations: Measuring Sustainable Development in the New Millennium" (2011).
Categories, topics:
Economy & Growth, Environment
Last updated:
apr 23, 2017
Indicators value changes by year
Meaning:
-16.692
Minimum:
-29.391
jan 1, 2014
Maximum:
-4.509
jan 1, 2001
At the date of observation
Value
Absolute change
Change from the previous value
jan 1, 2001
-4.509
-4.509
0.0%
jan 1, 2002
-14.077
-9.568
212.21%
jan 1, 2003
-5.277
+8.8
-62.51%
jan 1, 2004
-17.52
-12.242
232.0%
jan 1, 2005
-12.287
+5.233
-29.87%
jan 1, 2006
-10.984
+1.303
-10.6%
jan 1, 2007
-11.535
-0.551
5.02%
jan 1, 2008
-16.889
-5.353
46.41%
jan 1, 2009
-24.725
-7.836
46.4%
jan 1, 2010
-20.568
+4.157
-16.81%
jan 1, 2011
-18.76
+1.808
-8.79%
jan 1, 2012
-19.221
-0.46
2.45%
jan 1, 2013
-17.995
+1.226
-6.38%
jan 1, 2014
-29.391
-11.397
63.33%
jan 1, 2015
-26.641
+2.75
-9.36%
Ranking of countries by current statistics by years
