29
/
en
AIzaSyAYiBZKx7MnpbEhh9jyipgxe19OcubqV5w
April 1, 2024
276332
United States
USA
true
2
1
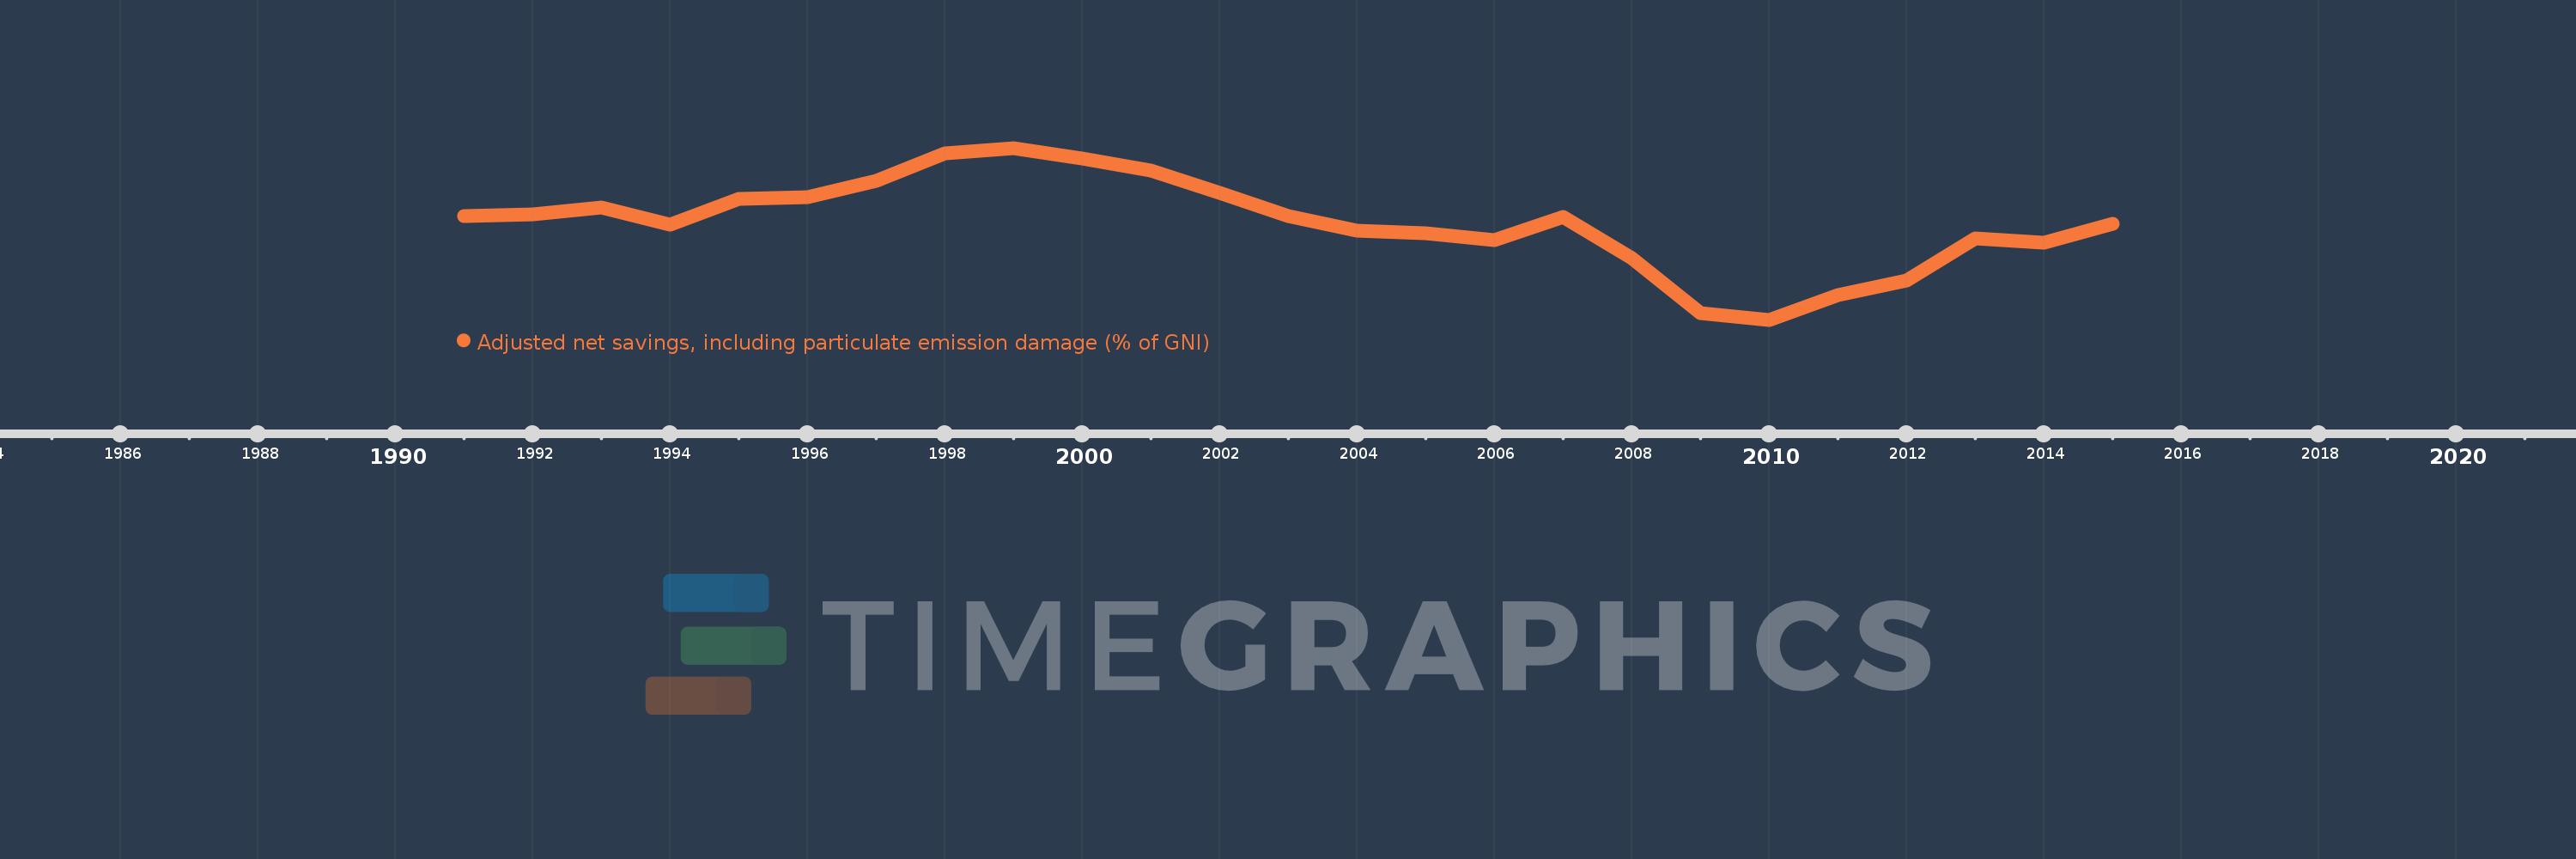
Adjusted net savings, including particulate emission damage (% of GNI)
2015,2014,2013,2012,2011,2010,2009,2008,2007,2006,2005,2004,2003,2002,2001,2000,1999,1998,1997,1996,1995,1994,1993,1992,1991
This statistics in other country:
AfghanistanAlbaniaAlgeriaAngolaArab WorldArgentinaArmeniaAustraliaAustriaAzerbaijanBahamas, TheBahrainBangladeshBarbadosBelarusBelgiumBelizeBeninBhutanBoliviaBotswanaBrazilBrunei DarussalamBulgariaBurkina FasoBurundiCabo VerdeCambodiaCameroonCanadaCaribbean small statesCentral African RepublicCentral Europe and the BalticsChadChileChinaColombiaComorosCongo, Dem. Rep.Congo, Rep.Costa RicaCote d'IvoireCroatiaCyprusCzech RepublicDenmarkDominican RepublicEarly-demographic dividendEast Asia & PacificEast Asia & Pacific (excluding high income)East Asia & Pacific (IDA & IBRD countries)EcuadorEgypt, Arab Rep.El SalvadorEquatorial GuineaEritreaEstoniaEthiopiaEuro areaEurope & Central AsiaEurope & Central Asia (excluding high income)Europe & Central Asia (IDA & IBRD countries)European UnionFijiFinlandFragile and conflict affected situationsFranceGabonGambia, TheGeorgiaGermanyGhanaGreeceGuatemalaGuineaGuinea-BissauGuyanaHaitiHeavily indebted poor countries (HIPC)High incomeHondurasHungaryIBRD onlyIcelandIDA & IBRD totalIDA blendIDA onlyIDA totalIndiaIndonesiaIran, Islamic Rep.IraqIrelandIsraelItalyJamaicaJapanJordanKazakhstanKenyaKorea, Rep.KuwaitKyrgyz RepublicLao PDRLate-demographic dividendLatin America & Caribbean Latin America & Caribbean (excluding high income)Latin America & the Caribbean (IDA & IBRD countries)LatviaLeast developed countries: UN classificationLebanonLesothoLiberiaLibyaLithuaniaLow & middle incomeLow incomeLower middle incomeLuxembourgMacedonia, FYRMadagascarMalawiMalaysiaMaldivesMaliMauritaniaMauritiusMexicoMiddle East & North AfricaMiddle East & North Africa (excluding high income)Middle East & North Africa (IDA & IBRD countries)Middle incomeMoldovaMongoliaMoroccoMozambiqueNamibiaNepalNetherlandsNew ZealandNicaraguaNigerNigeriaNorth AmericaNorwayOECD membersOmanOther small statesPacific island small statesPakistanPanamaPapua New GuineaParaguayPeruPhilippinesPolandPortugalPost-demographic dividendPre-demographic dividendQatarRomaniaRussian FederationRwandaSaudi ArabiaSenegalSierra LeoneSingaporeSlovak RepublicSloveniaSmall statesSolomon IslandsSouth AfricaSouth AsiaSouth Asia (IDA & IBRD)SpainSri LankaSub-Saharan Africa Sub-Saharan Africa (excluding high income)Sub-Saharan Africa (IDA & IBRD countries)SudanSurinameSwazilandSwedenSwitzerlandSyrian Arab RepublicTajikistanTanzaniaThailandTogoTrinidad and TobagoTunisiaTurkeyUgandaUkraineUnited KingdomUnited StatesUpper middle incomeUruguayVenezuela, RBVietnamWorldYemen, Rep.ZambiaZimbabwe Timeline:
This timeline shows a graph from 1991 to 2015 of United States. No data until 1990. Number of actual observations by date: 25.
Source name:
World Development Indicators
Source organization:
World Bank staff estimates based on sources and methods in World Bank's "The Changing Wealth of Nations: Measuring Sustainable Development in the New Millennium" (2011).
Categories, topics:
Economy & Growth, Environment
Last updated:
apr 23, 2017
Indicators value changes by year
Maximum:
10.299
jan 1, 1999
At the date of observation
Value
Absolute change
Change from previous value
jan 1, 1991
6.839
+6.839
0.0%
jan 1, 1992
6.91
+0.072
1.05%
jan 1, 1993
7.249
+0.338
4.9%
jan 1, 1994
6.393
-0.856
-11.81%
jan 1, 1995
7.703
+1.311
20.5%
jan 1, 1996
7.784
+0.081
1.05%
jan 1, 1997
8.632
+0.848
10.89%
jan 1, 1998
10.031
+1.399
16.2%
jan 1, 1999
10.299
+0.268
2.67%
jan 1, 2000
9.767
-0.532
-5.16%
jan 1, 2001
9.131
-0.636
-6.51%
jan 1, 2002
8.003
-1.128
-12.35%
jan 1, 2003
6.811
-1.193
-14.9%
jan 1, 2004
6.072
-0.739
-10.85%
jan 1, 2005
5.967
-0.105
-1.73%
jan 1, 2006
5.604
-0.363
-6.08%
jan 1, 2007
6.774
+1.17
20.89%
jan 1, 2008
4.67
-2.104
-31.06%
jan 1, 2009
1.89
-2.781
-59.54%
jan 1, 2010
1.549
-0.341
-18.03%
jan 1, 2011
2.798
+1.249
80.62%
jan 1, 2012
3.545
+0.748
26.73%
jan 1, 2013
5.69
+2.145
60.49%
jan 1, 2014
5.47
-0.22
-3.86%
jan 1, 2015
6.418
+0.948
17.33%
Ranking of countries by current statistics by years


Comments: