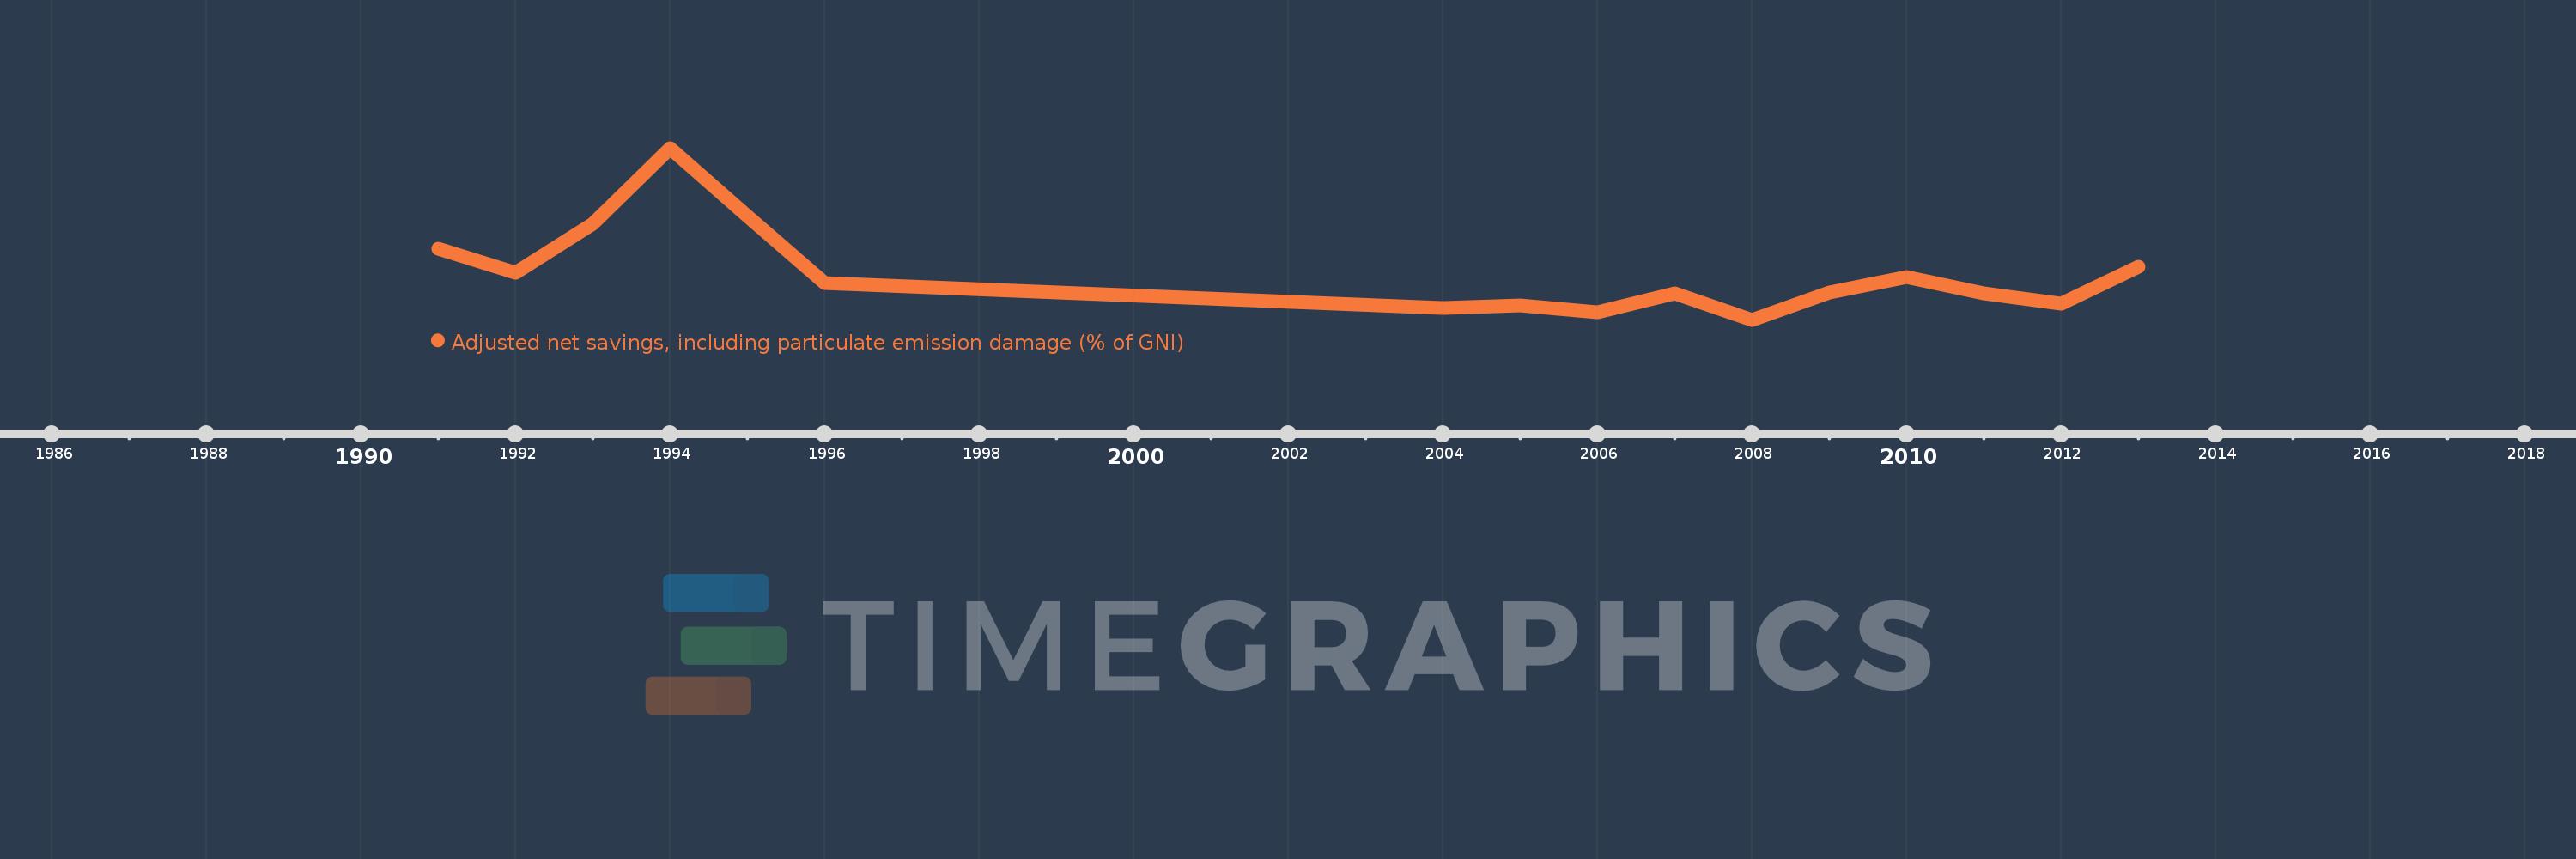
This timeline shows a graph from 1991 to 2013 of Comoros. No data until 1990. Number of actual observations by date: 16.
Source name:
World Development Indicators
Source organization:
World Bank staff estimates based on sources and methods in World Bank's "The Changing Wealth of Nations: Measuring Sustainable Development in the New Millennium" (2011).
Categories, topics:
Economy & Growth, Environment
Last updated:
apr 23, 2017
Indicators value changes by year
Meaning:
-2.799
Minimum:
-7.58
jan 1, 2008
Maximum:
9.931
jan 1, 1994
At the date of observation
Value
Absolute change
Change from the previous value
jan 1, 1991
-0.328
-0.328
0.0%
jan 1, 1992
-2.779
-2.451
746.17%
jan 1, 1993
2.238
+5.017
-180.52%
jan 1, 1994
9.931
+7.693
343.76%
jan 1, 1995
2.961
-6.97
-70.19%
jan 1, 1996
-3.871
-6.832
-230.74%
jan 1, 2004
-6.404
-2.533
65.43%
jan 1, 2005
-6.126
+0.278
-4.34%
jan 1, 2006
-6.81
-0.685
11.17%
jan 1, 2007
-4.903
+1.907
-28.0%
jan 1, 2008
-7.58
-2.677
54.6%
jan 1, 2009
-4.837
+2.744
-36.19%
jan 1, 2010
-3.254
+1.583
-32.73%
jan 1, 2011
-4.878
-1.625
49.94%
jan 1, 2012
-5.927
-1.048
21.49%
jan 1, 2013
-2.22
+3.707
-62.55%
Ranking of countries by current statistics by years
