29
/
en
AIzaSyAYiBZKx7MnpbEhh9jyipgxe19OcubqV5w
April 1, 2024
234349
Saudi Arabia
SAU
true
2
1
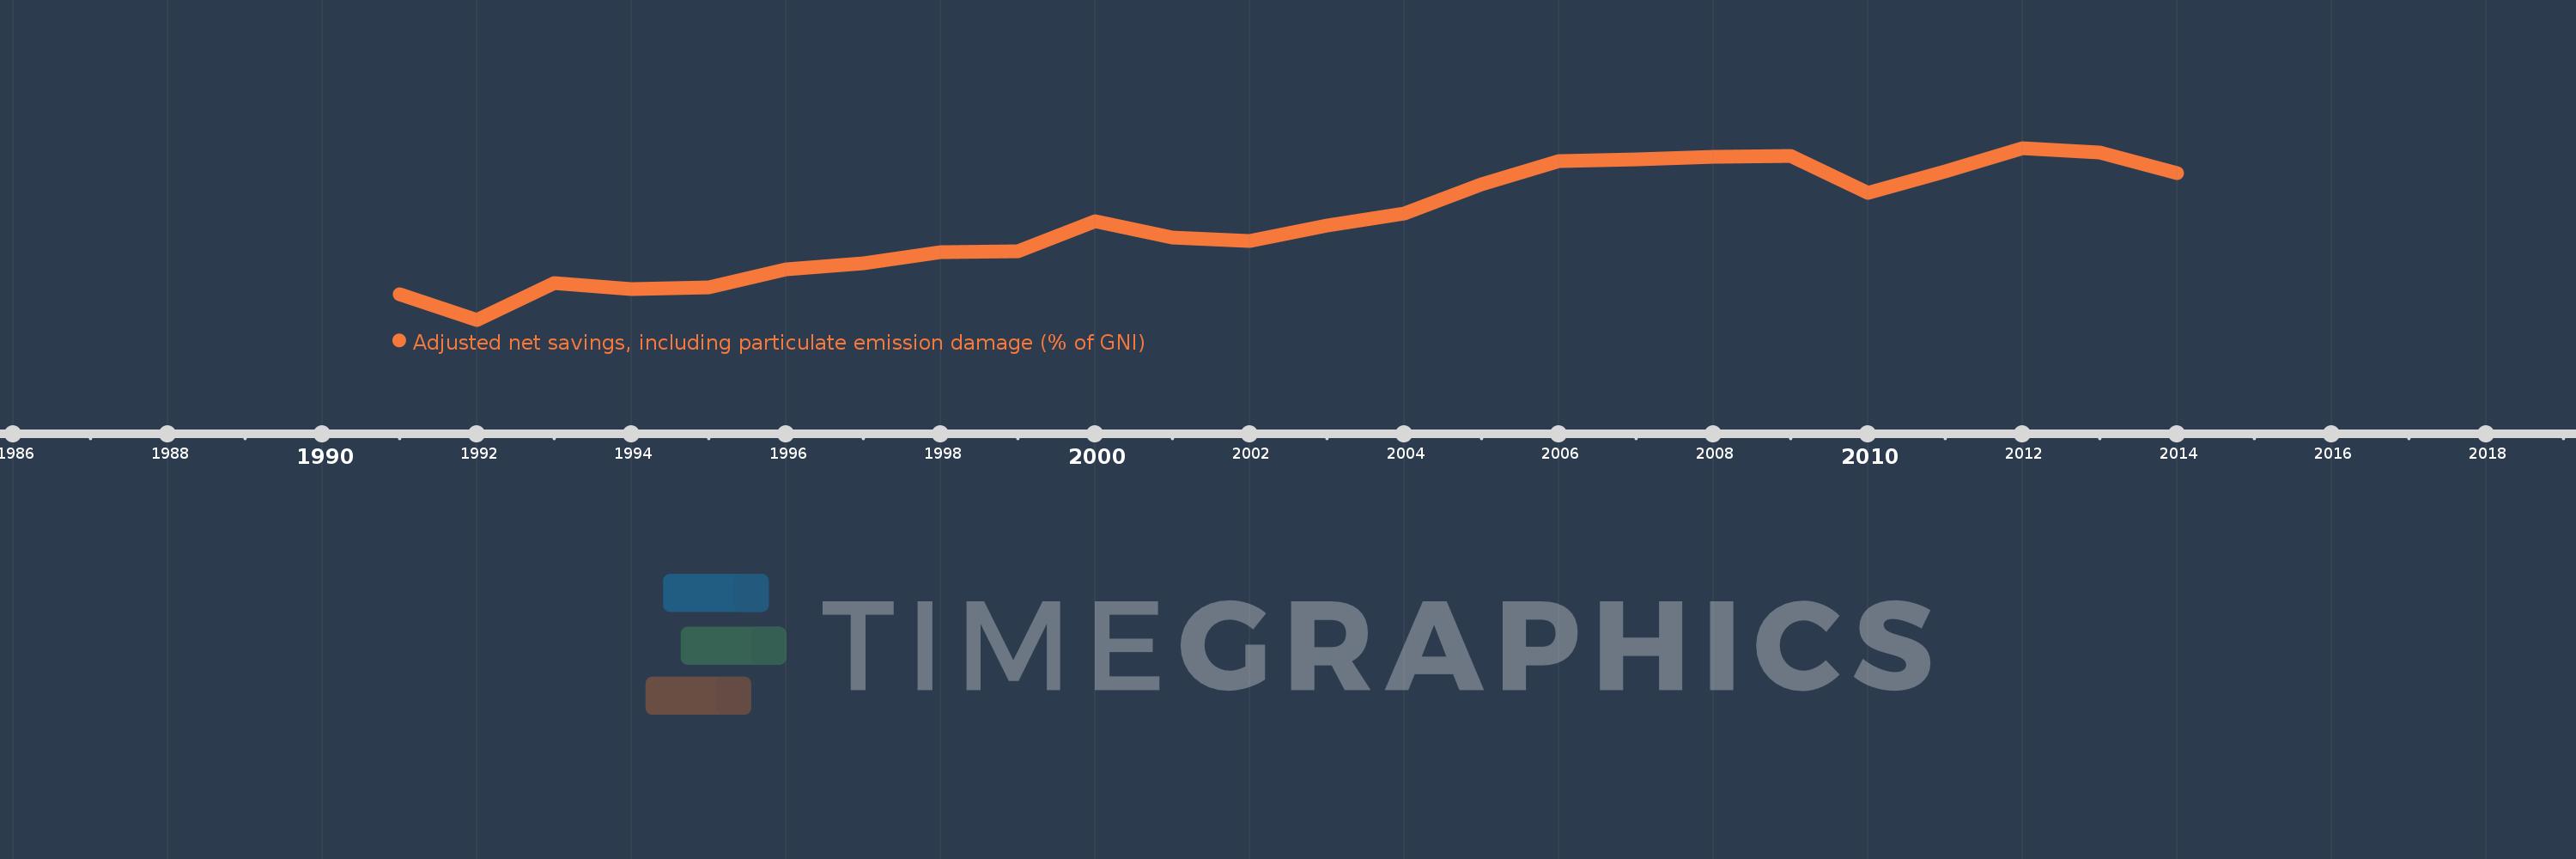
Adjusted net savings, including particulate emission damage (% of GNI)
2014,2013,2012,2011,2010,2009,2008,2007,2006,2005,2004,2003,2002,2001,2000,1999,1998,1997,1996,1995,1994,1993,1992,1991
This statistics in other country:
AfghanistanAlbaniaAlgeriaAngolaArab WorldArgentinaArmeniaAustraliaAustriaAzerbaijanBahamas, TheBahrainBangladeshBarbadosBelarusBelgiumBelizeBeninBhutanBoliviaBotswanaBrazilBrunei DarussalamBulgariaBurkina FasoBurundiCabo VerdeCambodiaCameroonCanadaCaribbean small statesCentral African RepublicCentral Europe and the BalticsChadChileChinaColombiaComorosCongo, Dem. Rep.Congo, Rep.Costa RicaCote d'IvoireCroatiaCyprusCzech RepublicDenmarkDominican RepublicEarly-demographic dividendEast Asia & PacificEast Asia & Pacific (excluding high income)East Asia & Pacific (IDA & IBRD countries)EcuadorEgypt, Arab Rep.El SalvadorEquatorial GuineaEritreaEstoniaEthiopiaEuro areaEurope & Central AsiaEurope & Central Asia (excluding high income)Europe & Central Asia (IDA & IBRD countries)European UnionFijiFinlandFragile and conflict affected situationsFranceGabonGambia, TheGeorgiaGermanyGhanaGreeceGuatemalaGuineaGuinea-BissauGuyanaHaitiHeavily indebted poor countries (HIPC)High incomeHondurasHungaryIBRD onlyIcelandIDA & IBRD totalIDA blendIDA onlyIDA totalIndiaIndonesiaIran, Islamic Rep.IraqIrelandIsraelItalyJamaicaJapanJordanKazakhstanKenyaKorea, Rep.KuwaitKyrgyz RepublicLao PDRLate-demographic dividendLatin America & Caribbean Latin America & Caribbean (excluding high income)Latin America & the Caribbean (IDA & IBRD countries)LatviaLeast developed countries: UN classificationLebanonLesothoLiberiaLibyaLithuaniaLow & middle incomeLow incomeLower middle incomeLuxembourgMacedonia, FYRMadagascarMalawiMalaysiaMaldivesMaliMauritaniaMauritiusMexicoMiddle East & North AfricaMiddle East & North Africa (excluding high income)Middle East & North Africa (IDA & IBRD countries)Middle incomeMoldovaMongoliaMoroccoMozambiqueNamibiaNepalNetherlandsNew ZealandNicaraguaNigerNigeriaNorth AmericaNorwayOECD membersOmanOther small statesPacific island small statesPakistanPanamaPapua New GuineaParaguayPeruPhilippinesPolandPortugalPost-demographic dividendPre-demographic dividendQatarRomaniaRussian FederationRwandaSaudi ArabiaSenegalSierra LeoneSingaporeSlovak RepublicSloveniaSmall statesSolomon IslandsSouth AfricaSouth AsiaSouth Asia (IDA & IBRD)SpainSri LankaSub-Saharan Africa Sub-Saharan Africa (excluding high income)Sub-Saharan Africa (IDA & IBRD countries)SudanSurinameSwazilandSwedenSwitzerlandSyrian Arab RepublicTajikistanTanzaniaThailandTogoTrinidad and TobagoTunisiaTurkeyUgandaUkraineUnited KingdomUnited StatesUpper middle incomeUruguayVenezuela, RBVietnamWorldYemen, Rep.ZambiaZimbabwe Timeline:
This timeline shows a graph from 1991 to 2014 of Saudi Arabia. No data until 1990. Number of actual observations by date: 24.
Source name:
World Development Indicators
Source organization:
World Bank staff estimates based on sources and methods in World Bank's "The Changing Wealth of Nations: Measuring Sustainable Development in the New Millennium" (2011).
Categories, topics:
Economy & Growth, Environment
Last updated:
apr 23, 2017
Indicators value changes by year
Minimum:
-10.574
jan 1, 1992
Maximum:
25.225
jan 1, 2012
At the date of observation
Value
Absolute change
Change from previous value
jan 1, 1991
-5.345
-5.345
0.0%
jan 1, 1992
-10.574
-5.229
97.83%
jan 1, 1993
-2.996
+7.578
-71.67%
jan 1, 1994
-4.221
-1.225
40.89%
jan 1, 1995
-3.801
+0.42
-9.95%
jan 1, 1996
-0.136
+3.665
-96.43%
jan 1, 1997
1.213
+1.349
-993.62%
jan 1, 1998
3.433
+2.22
183.05%
jan 1, 1999
3.658
+0.225
6.54%
jan 1, 2000
9.936
+6.279
171.65%
jan 1, 2001
6.47
-3.467
-34.89%
jan 1, 2002
5.858
-0.612
-9.46%
jan 1, 2003
9.084
+3.226
55.07%
jan 1, 2004
11.547
+2.464
27.12%
jan 1, 2005
17.644
+6.097
52.8%
jan 1, 2006
22.417
+4.772
27.05%
jan 1, 2007
22.77
+0.353
1.57%
jan 1, 2008
23.401
+0.632
2.77%
jan 1, 2009
23.483
+0.082
0.35%
jan 1, 2010
15.943
-7.541
-32.11%
jan 1, 2011
20.391
+4.449
27.9%
jan 1, 2012
25.225
+4.834
23.71%
jan 1, 2013
24.274
-0.951
-3.77%
jan 1, 2014
20.046
-4.228
-17.42%
Ranking of countries by current statistics by years


Comments: