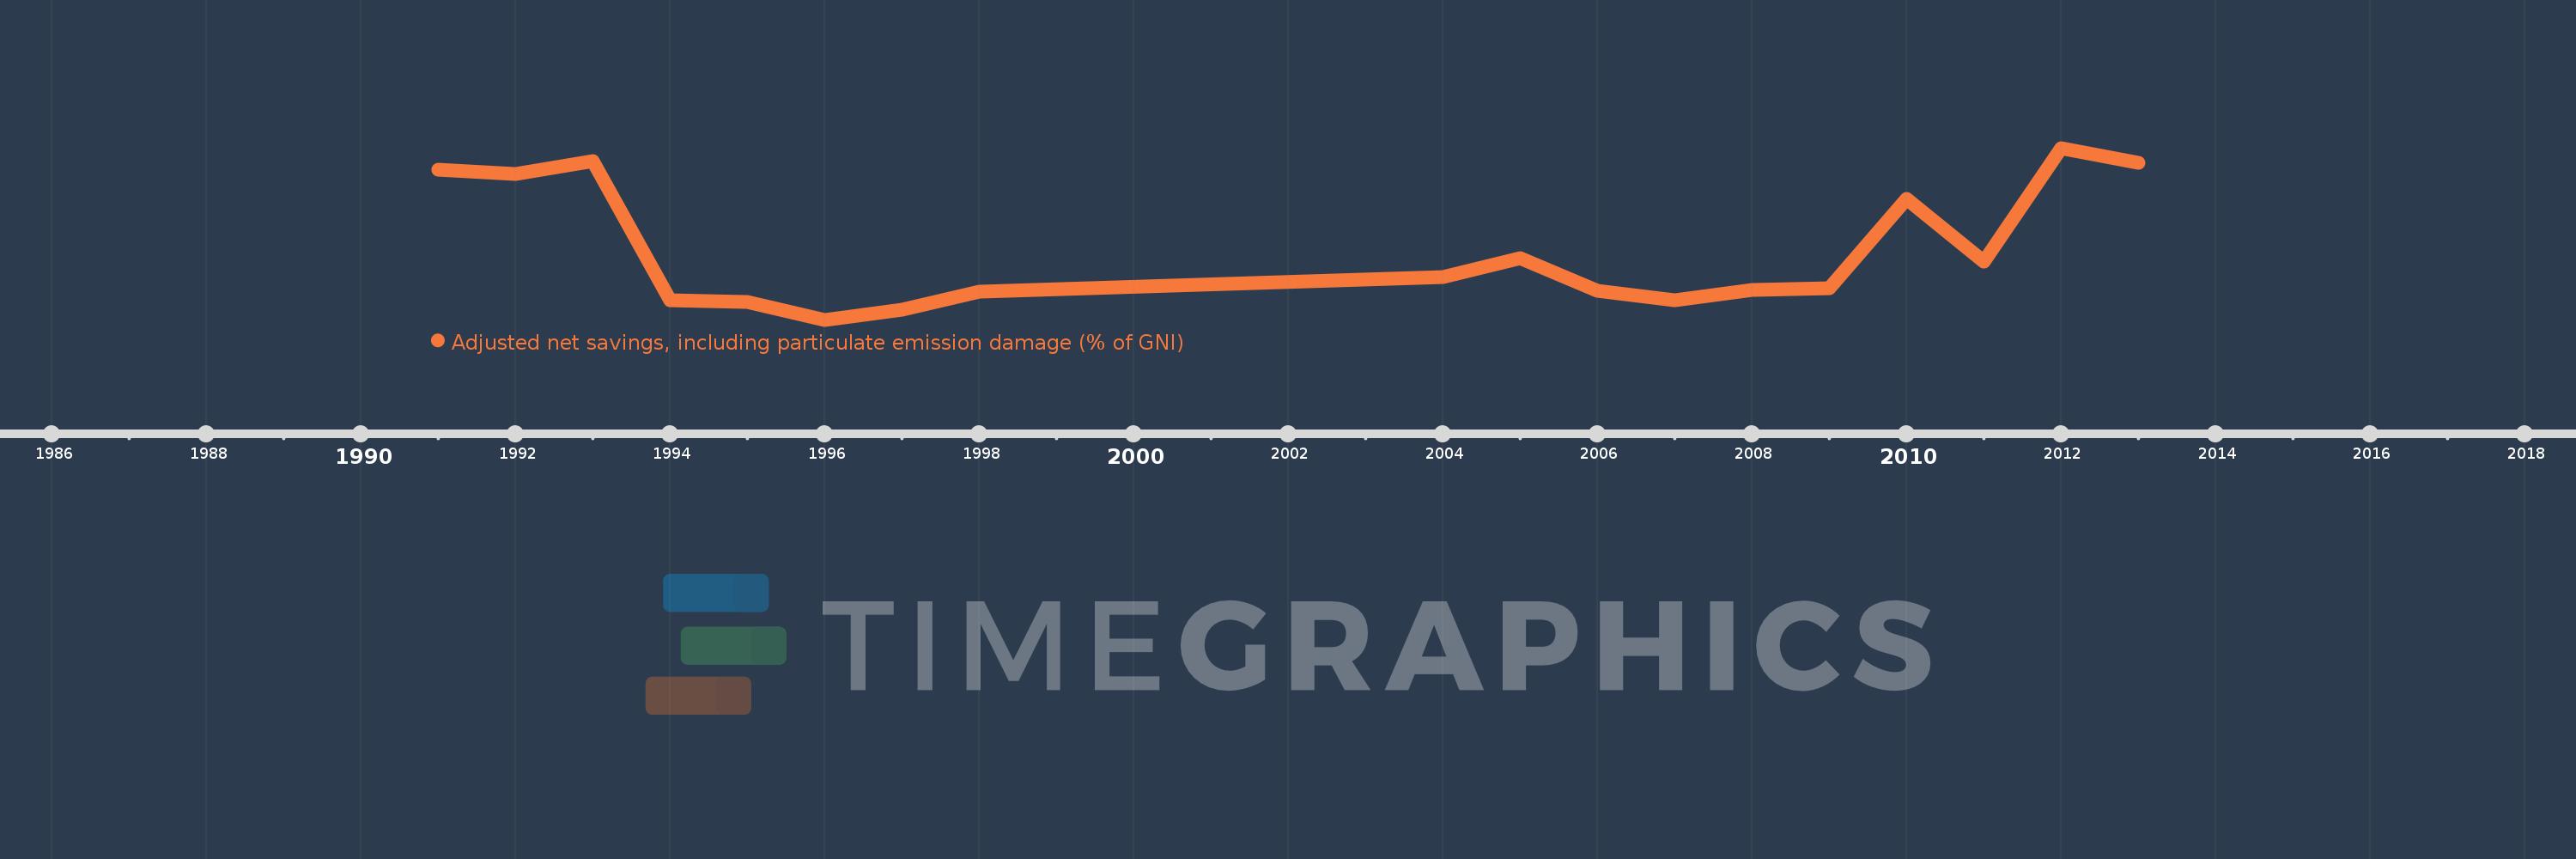
This timeline shows a graph from 1991 to 2013 of Gambia, The. No data until 1990. Number of actual observations by date: 18.
Source name:
World Development Indicators
Source organization:
World Bank staff estimates based on sources and methods in World Bank's "The Changing Wealth of Nations: Measuring Sustainable Development in the New Millennium" (2011).
Categories, topics:
Economy & Growth, Environment
Last updated:
apr 23, 2017
Indicators value changes by year
Meaning:
-6.109
Minimum:
-17.511
jan 1, 1996
Maximum:
10.657
jan 1, 2012
At the date of observation
Value
Absolute change
Change from the previous value
jan 1, 1991
7.031
+7.031
0.0%
jan 1, 1992
6.417
-0.614
-8.74%
jan 1, 1993
8.482
+2.066
32.19%
jan 1, 1994
-14.258
-22.74
-268.09%
jan 1, 1995
-14.633
-0.375
2.63%
jan 1, 1996
-17.511
-2.878
19.67%
jan 1, 1997
-15.878
+1.633
-9.32%
jan 1, 1998
-12.95
+2.928
-18.44%
jan 1, 2004
-10.56
+2.39
-18.45%
jan 1, 2005
-7.441
+3.119
-29.53%
jan 1, 2006
-12.696
-5.254
70.61%
jan 1, 2007
-14.339
-1.644
12.95%
jan 1, 2008
-12.666
+1.674
-11.67%
jan 1, 2009
-12.287
+0.379
-2.99%
jan 1, 2010
2.365
+14.651
-119.25%
jan 1, 2011
-7.973
-10.338
-437.18%
jan 1, 2012
10.657
+18.63
-233.66%
jan 1, 2013
8.273
-2.384
-22.37%
Ranking of countries by current statistics by years
