29
/
en
AIzaSyAYiBZKx7MnpbEhh9jyipgxe19OcubqV5w
April 1, 2024
123069
Ecuador
ECU
true
2
1
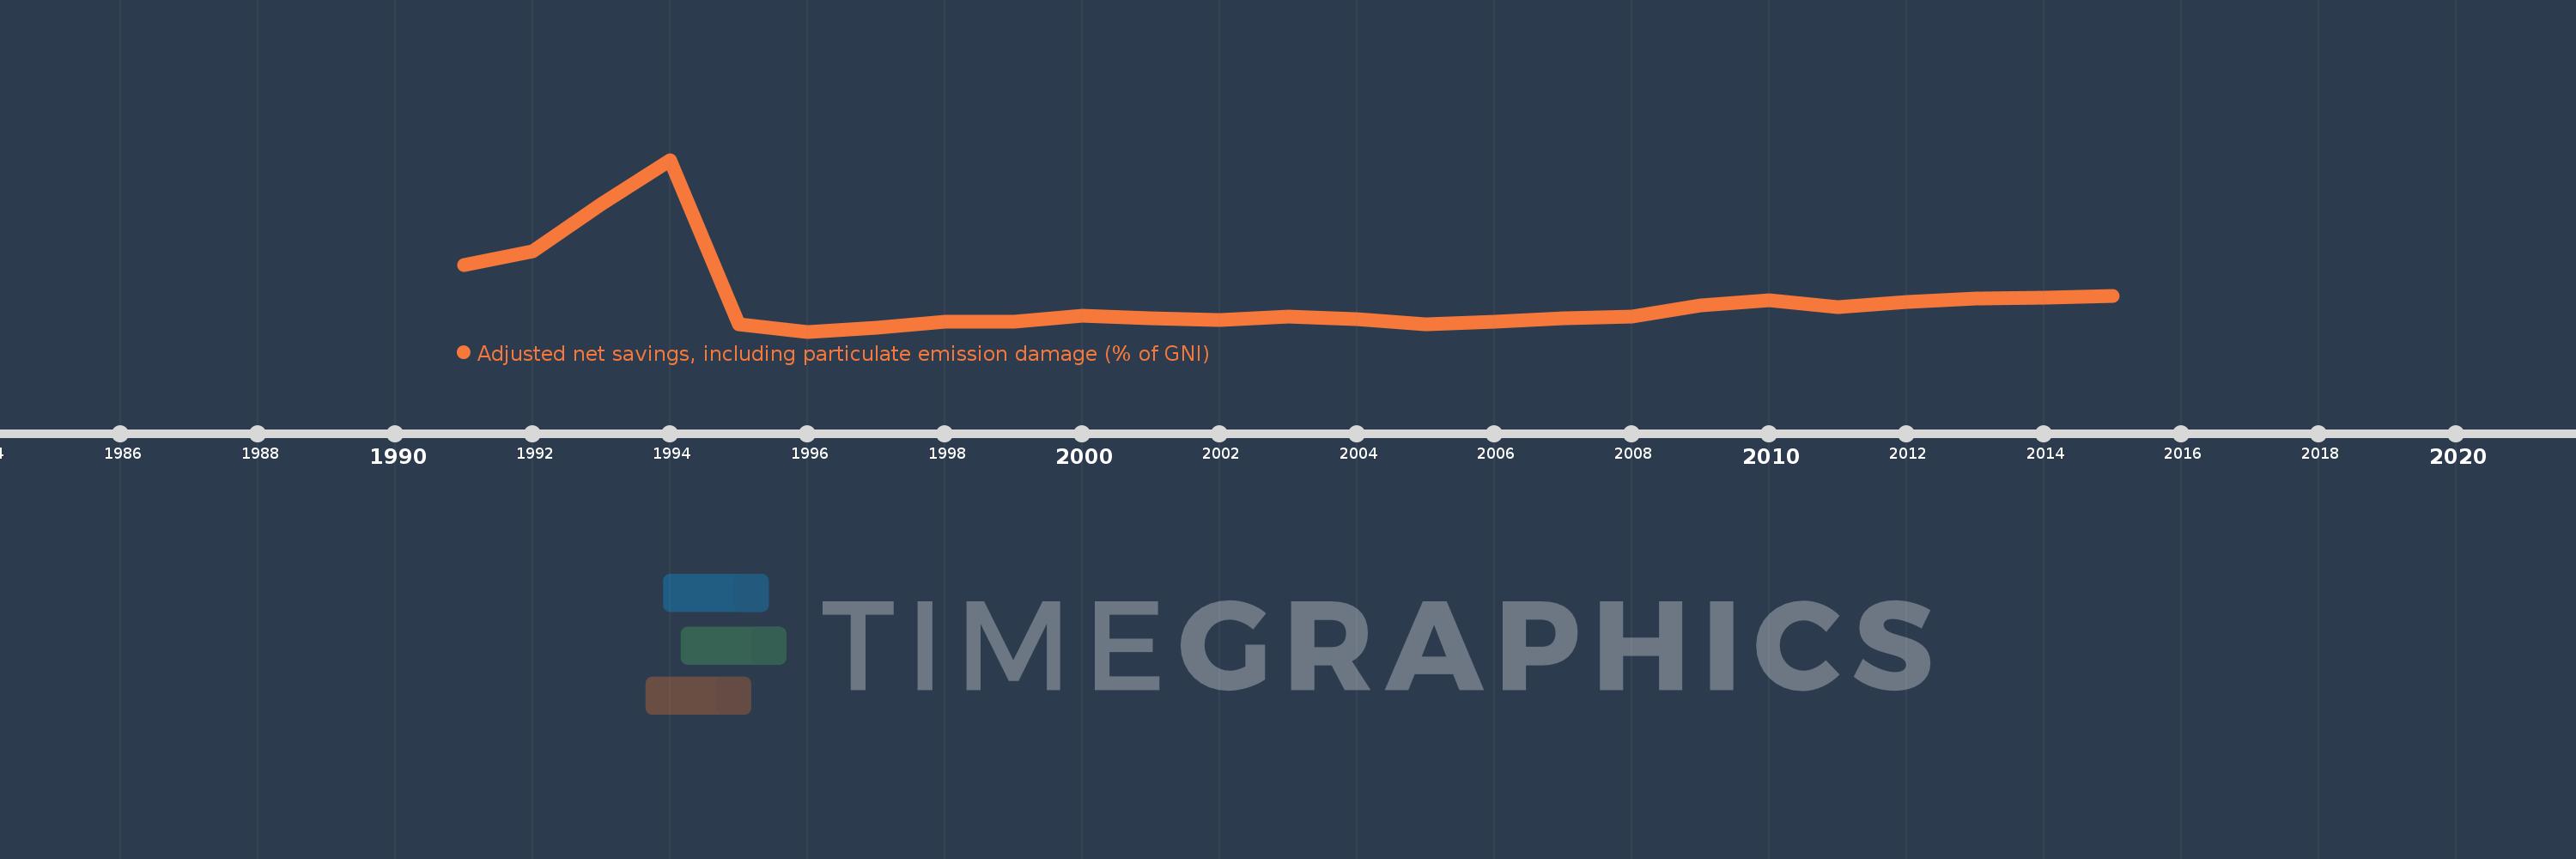
Adjusted net savings, including particulate emission damage (% of GNI)
2015,2014,2013,2012,2011,2010,2009,2008,2007,2006,2005,2004,2003,2002,2001,2000,1999,1998,1997,1996,1995,1994,1993,1992,1991
This statistics in other country:
AfghanistanAlbaniaAlgeriaAngolaArab WorldArgentinaArmeniaAustraliaAustriaAzerbaijanBahamas, TheBahrainBangladeshBarbadosBelarusBelgiumBelizeBeninBhutanBoliviaBotswanaBrazilBrunei DarussalamBulgariaBurkina FasoBurundiCabo VerdeCambodiaCameroonCanadaCaribbean small statesCentral African RepublicCentral Europe and the BalticsChadChileChinaColombiaComorosCongo, Dem. Rep.Congo, Rep.Costa RicaCote d'IvoireCroatiaCyprusCzech RepublicDenmarkDominican RepublicEarly-demographic dividendEast Asia & PacificEast Asia & Pacific (excluding high income)East Asia & Pacific (IDA & IBRD countries)EcuadorEgypt, Arab Rep.El SalvadorEquatorial GuineaEritreaEstoniaEthiopiaEuro areaEurope & Central AsiaEurope & Central Asia (excluding high income)Europe & Central Asia (IDA & IBRD countries)European UnionFijiFinlandFragile and conflict affected situationsFranceGabonGambia, TheGeorgiaGermanyGhanaGreeceGuatemalaGuineaGuinea-BissauGuyanaHaitiHeavily indebted poor countries (HIPC)High incomeHondurasHungaryIBRD onlyIcelandIDA & IBRD totalIDA blendIDA onlyIDA totalIndiaIndonesiaIran, Islamic Rep.IraqIrelandIsraelItalyJamaicaJapanJordanKazakhstanKenyaKorea, Rep.KuwaitKyrgyz RepublicLao PDRLate-demographic dividendLatin America & Caribbean Latin America & Caribbean (excluding high income)Latin America & the Caribbean (IDA & IBRD countries)LatviaLeast developed countries: UN classificationLebanonLesothoLiberiaLibyaLithuaniaLow & middle incomeLow incomeLower middle incomeLuxembourgMacedonia, FYRMadagascarMalawiMalaysiaMaldivesMaliMauritaniaMauritiusMexicoMiddle East & North AfricaMiddle East & North Africa (excluding high income)Middle East & North Africa (IDA & IBRD countries)Middle incomeMoldovaMongoliaMoroccoMozambiqueNamibiaNepalNetherlandsNew ZealandNicaraguaNigerNigeriaNorth AmericaNorwayOECD membersOmanOther small statesPacific island small statesPakistanPanamaPapua New GuineaParaguayPeruPhilippinesPolandPortugalPost-demographic dividendPre-demographic dividendQatarRomaniaRussian FederationRwandaSaudi ArabiaSenegalSierra LeoneSingaporeSlovak RepublicSloveniaSmall statesSolomon IslandsSouth AfricaSouth AsiaSouth Asia (IDA & IBRD)SpainSri LankaSub-Saharan Africa Sub-Saharan Africa (excluding high income)Sub-Saharan Africa (IDA & IBRD countries)SudanSurinameSwazilandSwedenSwitzerlandSyrian Arab RepublicTajikistanTanzaniaThailandTogoTrinidad and TobagoTunisiaTurkeyUgandaUkraineUnited KingdomUnited StatesUpper middle incomeUruguayVenezuela, RBVietnamWorldYemen, Rep.ZambiaZimbabwe Timeline:
This timeline shows a graph from 1991 to 2015 of Ecuador. No data until 1990. Number of actual observations by date: 25.
Source name:
World Development Indicators
Source organization:
World Bank staff estimates based on sources and methods in World Bank's "The Changing Wealth of Nations: Measuring Sustainable Development in the New Millennium" (2011).
Categories, topics:
Economy & Growth, Environment
Last updated:
apr 23, 2017
Indicators value changes by year
Minimum:
-6.327
jan 1, 1996
Maximum:
77.924
jan 1, 1994
At the date of observation
Value
Absolute change
Change from previous value
jan 1, 1991
26.125
+26.125
0.0%
jan 1, 1992
32.852
+6.727
25.75%
jan 1, 1993
56.426
+23.573
71.75%
jan 1, 1994
77.924
+21.498
38.1%
jan 1, 1995
-2.776
-80.699
-103.56%
jan 1, 1996
-6.327
-3.551
127.96%
jan 1, 1997
-4.32
+2.007
-31.72%
jan 1, 1998
-1.457
+2.863
-66.28%
jan 1, 1999
-1.609
-0.152
10.42%
jan 1, 2000
1.67
+3.279
-203.81%
jan 1, 2001
0.079
-1.591
-95.26%
jan 1, 2002
-0.701
-0.78
-985.89%
jan 1, 2003
0.945
+1.645
-234.83%
jan 1, 2004
-0.242
-1.186
-125.57%
jan 1, 2005
-2.757
-2.515
1.04K%
jan 1, 2006
-1.626
+1.131
-41.02%
jan 1, 2007
0.261
+1.887
-116.05%
jan 1, 2008
1.223
+0.962
368.66%
jan 1, 2009
6.466
+5.243
428.73%
jan 1, 2010
9.067
+2.601
40.22%
jan 1, 2011
5.815
-3.252
-35.87%
jan 1, 2012
8.416
+2.601
44.73%
jan 1, 2013
10.001
+1.585
18.83%
jan 1, 2014
10.211
+0.21
2.1%
jan 1, 2015
11.226
+1.015
9.94%
Ranking of countries by current statistics by years


Comments: