29
/
en
AIzaSyAYiBZKx7MnpbEhh9jyipgxe19OcubqV5w
April 1, 2024
183941
Macedonia, FYR
MKD
true
2
1
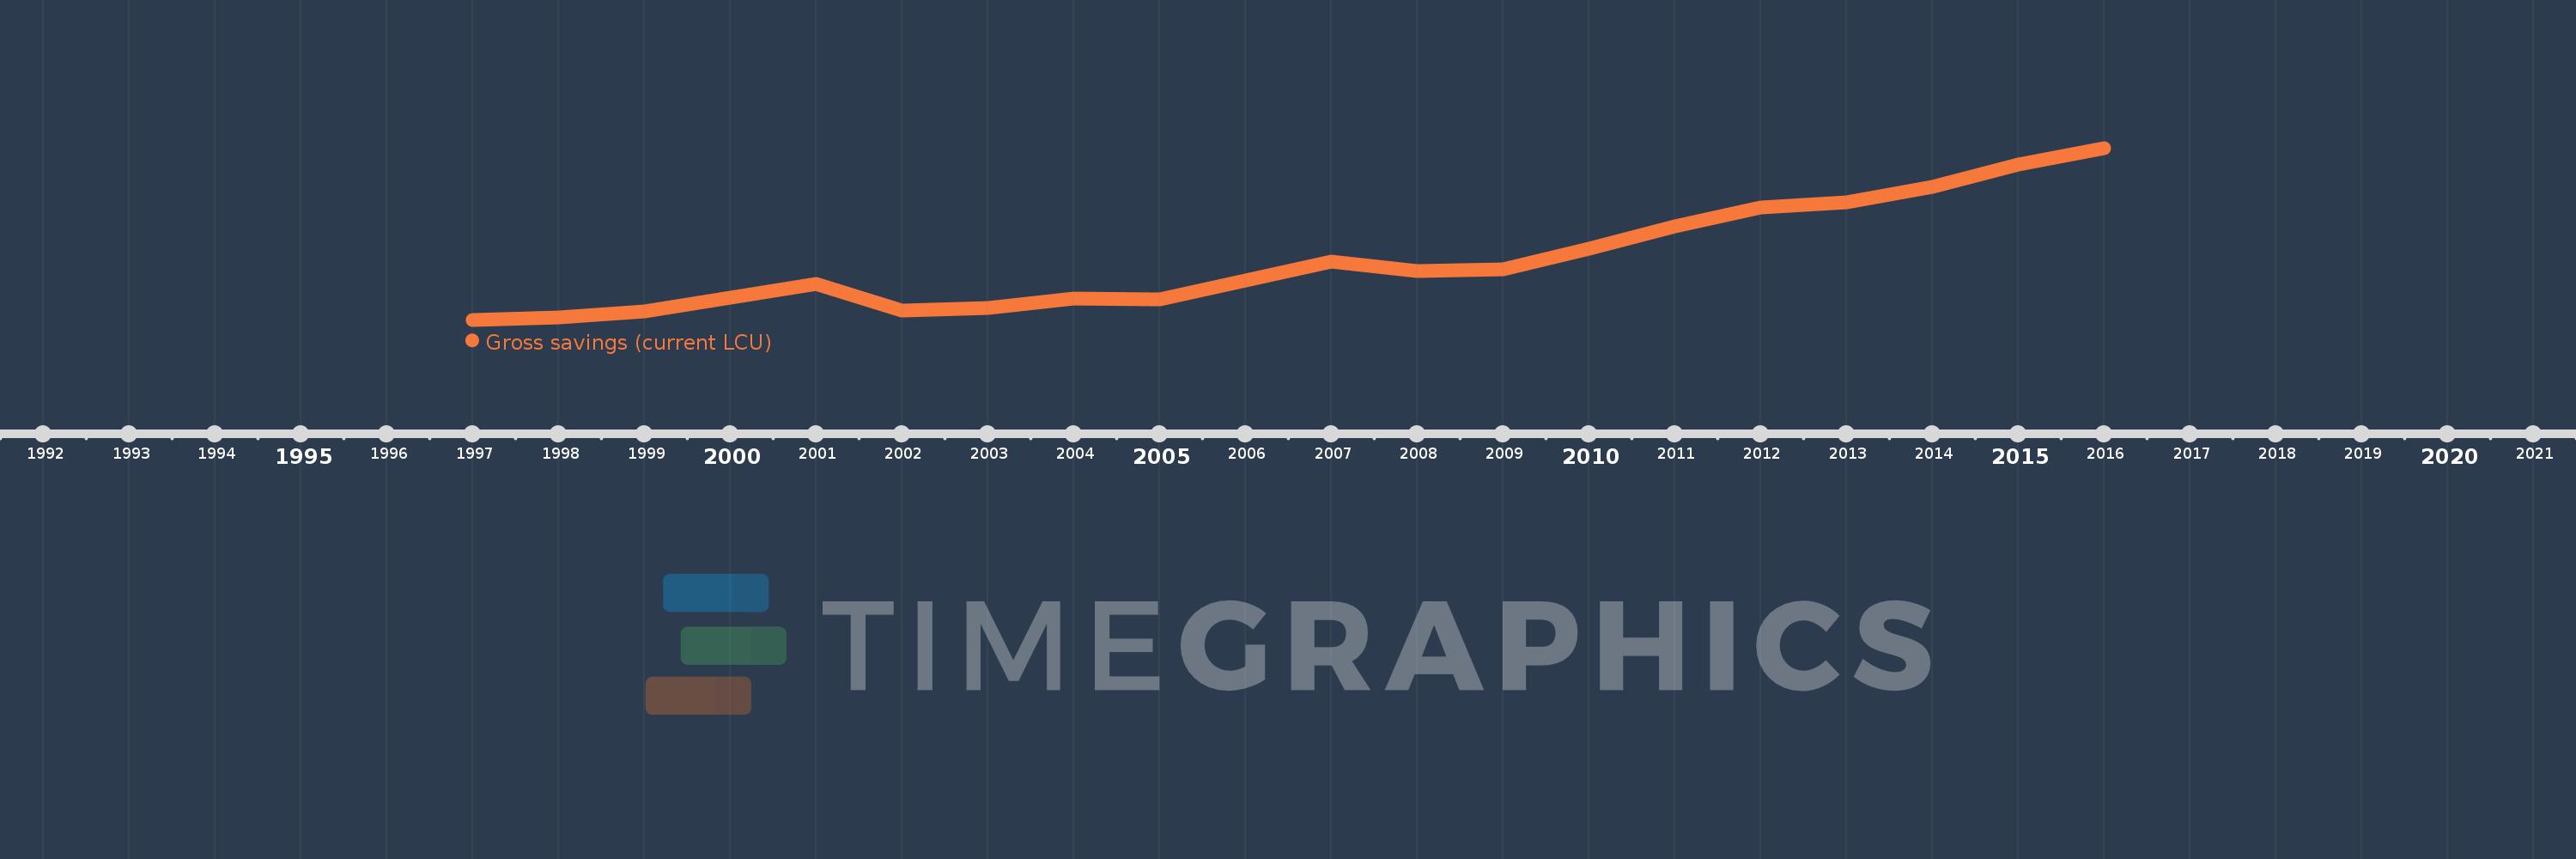
Gross savings (current LCU)
2016,2015,2014,2013,2012,2011,2010,2009,2008,2007,2006,2005,2004,2003,2002,2001,2000,1999,1998,1997
This statistics in other country:
AfghanistanAlbaniaAlgeriaAngolaAntigua and BarbudaArgentinaArmeniaAustraliaAustriaAzerbaijanBahamas, TheBahrainBangladeshBarbadosBelarusBelgiumBelizeBeninBermudaBhutanBoliviaBosnia and HerzegovinaBotswanaBrazilBrunei DarussalamBulgariaBurkina FasoBurundiCabo VerdeCambodiaCameroonCanadaCentral African RepublicChadChileChinaColombiaComorosCongo, Dem. Rep.Congo, Rep.Costa RicaCote d'IvoireCroatiaCyprusCzech RepublicDenmarkDjiboutiDominicaDominican RepublicEcuadorEgypt, Arab Rep.El SalvadorEquatorial GuineaEritreaEstoniaEthiopiaFaroe IslandsFijiFinlandFranceGabonGambia, TheGeorgiaGermanyGhanaGreeceGrenadaGuatemalaGuineaGuinea-BissauGuyanaHaitiHondurasHong Kong SAR, ChinaHungaryIcelandIndiaIndonesiaIran, Islamic Rep.IraqIrelandIsraelItalyJamaicaJapanJordanKazakhstanKenyaKiribatiKorea, Rep.KosovoKuwaitKyrgyz RepublicLao PDRLatviaLebanonLesothoLiberiaLibyaLithuaniaLuxembourgMacao SAR, ChinaMacedonia, FYRMadagascarMalawiMalaysiaMaldivesMaliMaltaMauritaniaMauritiusMexicoMoldovaMongoliaMontenegroMoroccoMozambiqueNamibiaNepalNetherlandsNew ZealandNicaraguaNigerNigeriaNorwayOmanPakistanPanamaPapua New GuineaParaguayPeruPhilippinesPolandPortugalQatarRomaniaRussian FederationRwandaSaudi ArabiaSenegalSerbiaSeychellesSierra LeoneSingaporeSlovak RepublicSloveniaSolomon IslandsSouth AfricaSouth SudanSpainSri LankaSt. Kitts and NevisSt. LuciaSt. Vincent and the GrenadinesSudanSurinameSwazilandSwedenSwitzerlandSyrian Arab RepublicTajikistanTanzaniaThailandTimor-LesteTogoTongaTrinidad and TobagoTunisiaTurkeyUgandaUkraineUnited KingdomUnited StatesUruguayVanuatuVenezuela, RBVietnamWest Bank and GazaYemen, Rep.ZambiaZimbabwe Timeline:
This timeline shows a graph from 1997 to 2016 of Macedonia, FYR. No data until 1996. Number of actual observations by date: 20.
Source name:
World Development Indicators
Source organization:
World Bank national accounts data, and OECD National Accounts data files.
Categories, topics:
Economy & Growth
Last updated:
apr 23, 2017
Indicators value changes by year
Minimum:
23.656 bln
jan 1, 1997
Maximum:
171.178 bln
jan 1, 2016
At the date of observation
Value
Absolute change
Change from previous value
jan 1, 1997
23.656 bln
+23.656 bln
0.0%
jan 1, 1998
25.578 bln
+1.922 bln
8.12%
jan 1, 1999
30.524 bln
+4.947 bln
19.34%
jan 1, 2000
42.58 bln
+12.056 bln
39.5%
jan 1, 2001
54.455 bln
+11.875 bln
27.89%
jan 1, 2002
31.916 bln
-22.539 bln
-41.39%
jan 1, 2003
33.782 bln
+1.865 bln
5.84%
jan 1, 2004
42.22 bln
+8.438 bln
24.98%
jan 1, 2005
40.918 bln
-1.301 bln
-3.08%
jan 1, 2006
57.224 bln
+16.306 bln
39.85%
jan 1, 2007
73.328 bln
+16.104 bln
28.14%
jan 1, 2008
65.778 bln
-7.55 bln
-10.3%
jan 1, 2009
67.209 bln
+1.431 bln
2.18%
jan 1, 2010
84.658 bln
+17.449 bln
25.96%
jan 1, 2011
104.074 bln
+19.416 bln
22.93%
jan 1, 2012
120.089 bln
+16.015 bln
15.39%
jan 1, 2013
124.43 bln
+4.341 bln
3.61%
jan 1, 2014
137.399 bln
+12.969 bln
10.42%
jan 1, 2015
157.083 bln
+19.684 bln
14.33%
jan 1, 2016
171.178 bln
+14.095 bln
8.97%
Ranking of countries by current statistics by years


Comments: