29
/
en
AIzaSyAYiBZKx7MnpbEhh9jyipgxe19OcubqV5w
April 1, 2024
210446
Nicaragua
NIC
true
2
1
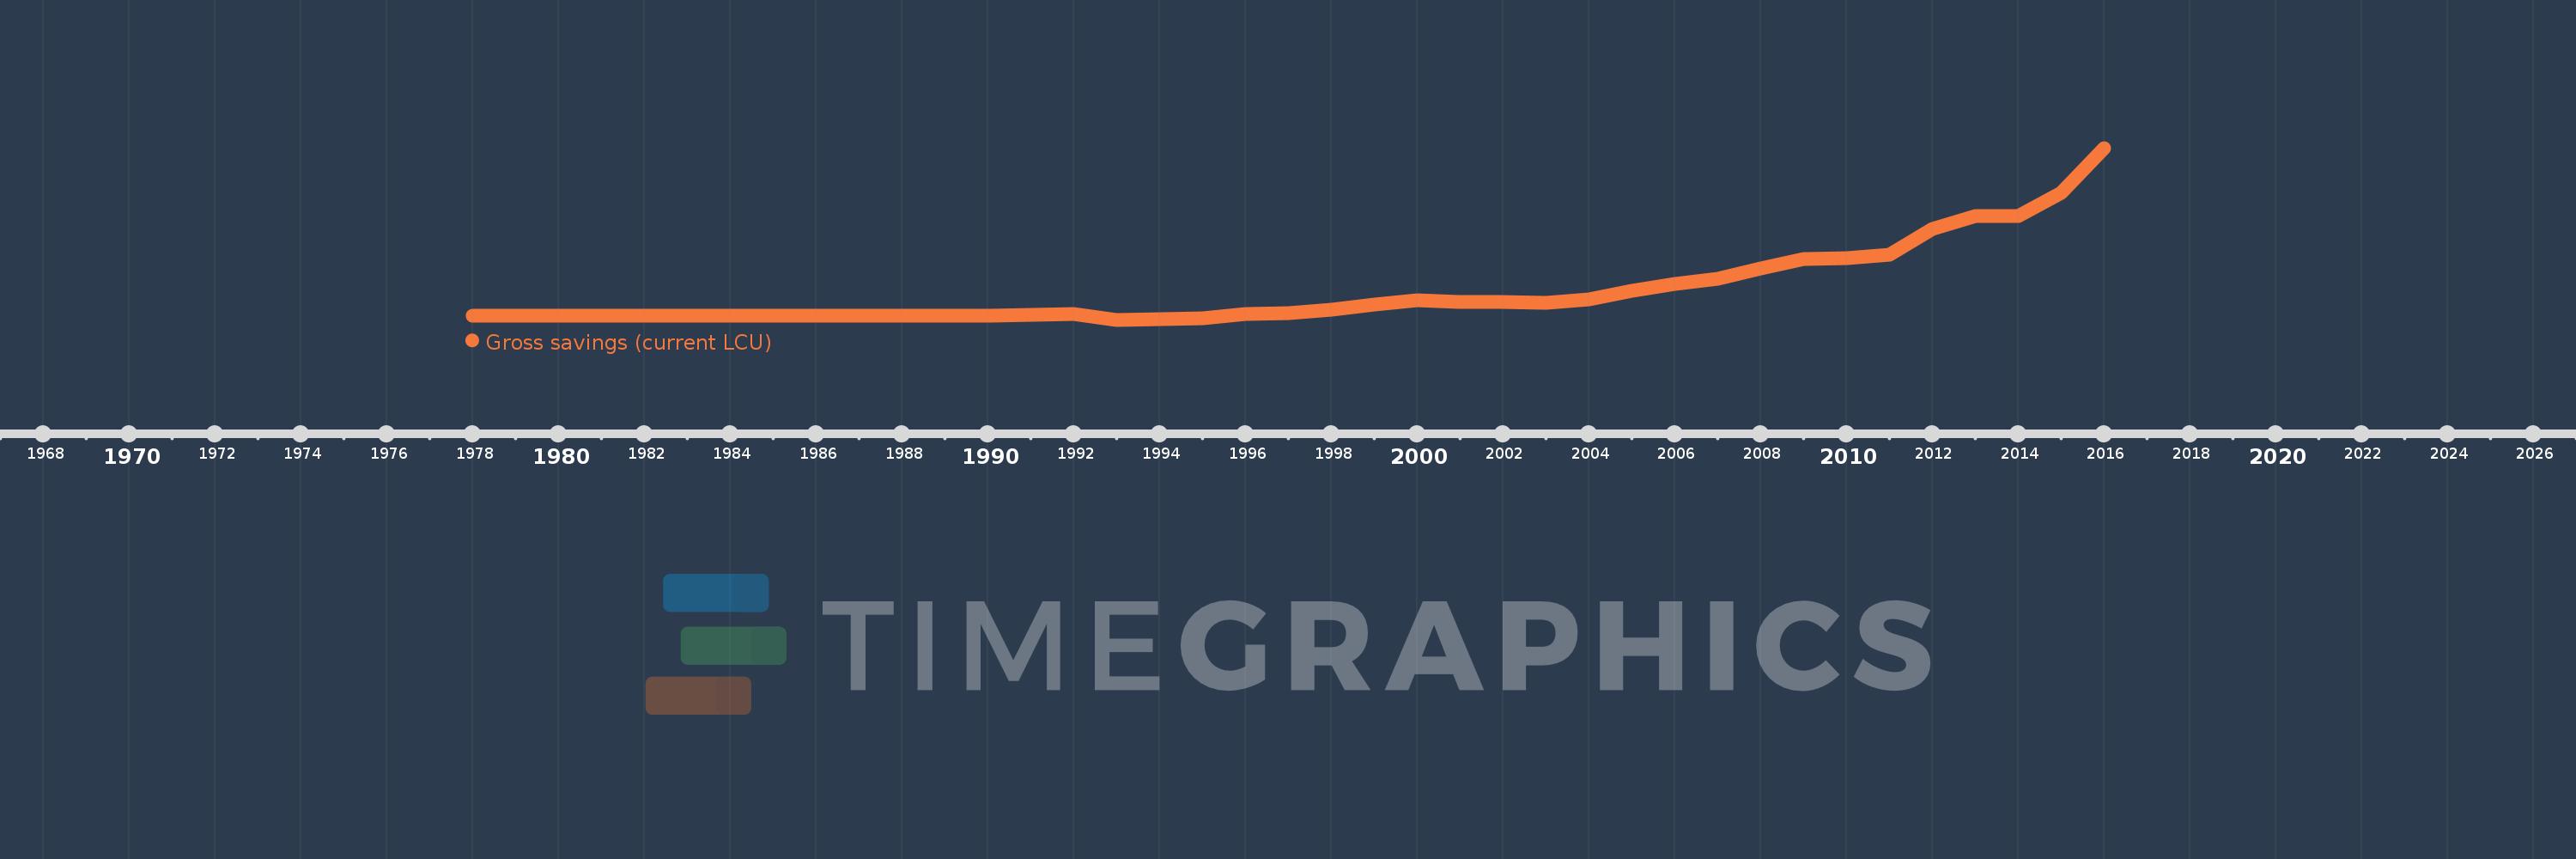
Gross savings (current LCU)
2016,2015,2014,2013,2012,2011,2010,2009,2008,2007,2006,2005,2004,2003,2002,2001,2000,1999,1998,1997,1996,1995,1994,1993,1992,1991,1990,1989,1988,1987,1986,1985,1984,1983,1982,1981,1980,1979,1978
This statistics in other country:
AfghanistanAlbaniaAlgeriaAngolaAntigua and BarbudaArgentinaArmeniaAustraliaAustriaAzerbaijanBahamas, TheBahrainBangladeshBarbadosBelarusBelgiumBelizeBeninBermudaBhutanBoliviaBosnia and HerzegovinaBotswanaBrazilBrunei DarussalamBulgariaBurkina FasoBurundiCabo VerdeCambodiaCameroonCanadaCentral African RepublicChadChileChinaColombiaComorosCongo, Dem. Rep.Congo, Rep.Costa RicaCote d'IvoireCroatiaCyprusCzech RepublicDenmarkDjiboutiDominicaDominican RepublicEcuadorEgypt, Arab Rep.El SalvadorEquatorial GuineaEritreaEstoniaEthiopiaFaroe IslandsFijiFinlandFranceGabonGambia, TheGeorgiaGermanyGhanaGreeceGrenadaGuatemalaGuineaGuinea-BissauGuyanaHaitiHondurasHong Kong SAR, ChinaHungaryIcelandIndiaIndonesiaIran, Islamic Rep.IraqIrelandIsraelItalyJamaicaJapanJordanKazakhstanKenyaKiribatiKorea, Rep.KosovoKuwaitKyrgyz RepublicLao PDRLatviaLebanonLesothoLiberiaLibyaLithuaniaLuxembourgMacao SAR, ChinaMacedonia, FYRMadagascarMalawiMalaysiaMaldivesMaliMaltaMauritaniaMauritiusMexicoMoldovaMongoliaMontenegroMoroccoMozambiqueNamibiaNepalNetherlandsNew ZealandNicaraguaNigerNigeriaNorwayOmanPakistanPanamaPapua New GuineaParaguayPeruPhilippinesPolandPortugalQatarRomaniaRussian FederationRwandaSaudi ArabiaSenegalSerbiaSeychellesSierra LeoneSingaporeSlovak RepublicSloveniaSolomon IslandsSouth AfricaSouth SudanSpainSri LankaSt. Kitts and NevisSt. LuciaSt. Vincent and the GrenadinesSudanSurinameSwazilandSwedenSwitzerlandSyrian Arab RepublicTajikistanTanzaniaThailandTimor-LesteTogoTongaTrinidad and TobagoTunisiaTurkeyUgandaUkraineUnited KingdomUnited StatesUruguayVanuatuVenezuela, RBVietnamWest Bank and GazaYemen, Rep.ZambiaZimbabwe Timeline:
This timeline shows a graph from 1978 to 2016 of Nicaragua. No data until 1977. Number of actual observations by date: 39.
Source name:
World Development Indicators
Source organization:
World Bank national accounts data, and OECD National Accounts data files.
Categories, topics:
Economy & Growth
Last updated:
apr 23, 2017
Indicators value changes by year
Minimum:
-2.152 bln
jan 1, 1993
Maximum:
81.052 bln
jan 1, 2016
At the date of observation
Value
Absolute change
Change from previous value
jan 1, 1978
0.452
+0.452
0.0%
jan 1, 1979
0.206
-0.246
-54.39%
jan 1, 1980
0.149
-0.057
-27.85%
jan 1, 1981
-0.102
-0.25
-168.34%
jan 1, 1982
-0.013
+0.089
-87.56%
jan 1, 1983
0.245
+0.258
-2.04K%
jan 1, 1984
0.55
+0.305
124.1%
jan 1, 1985
0.565
+0.015
2.68%
jan 1, 1986
2.962
+2.397
424.58%
jan 1, 1987
9.115
+6.153
207.75%
jan 1, 1988
88.877
+79.761
875.01%
jan 1, 1989
-14.594K
-14.683K
-16.52K%
jan 1, 1990
-290.008K
-275.414K
1.89K%
jan 1, 1991
24.574 mln
+24.864 mln
-8.57K%
jan 1, 1992
521.027 mln
+496.453 mln
2.02K%
jan 1, 1993
-2.152 bln
-2.673 bln
-512.97%
jan 1, 1994
-1.824 bln
+328.028 mln
-15.25%
jan 1, 1995
-1.623 bln
+200.221 mln
-10.98%
jan 1, 1996
456.356 mln
+2.08 bln
-128.11%
jan 1, 1997
1.215 bln
+758.54 mln
166.22%
jan 1, 1998
2.67 bln
+1.455 bln
119.8%
jan 1, 1999
5.214 bln
+2.543 bln
95.25%
jan 1, 2000
7.425 bln
+2.211 bln
42.41%
jan 1, 2001
6.256 bln
-1.169 bln
-15.74%
jan 1, 2002
6.455 bln
+199.177 mln
3.18%
jan 1, 2003
6.138 bln
-317.599 mln
-4.92%
jan 1, 2004
7.647 bln
+1.509 bln
24.58%
jan 1, 2005
11.769 bln
+4.123 bln
53.92%
jan 1, 2006
15.014 bln
+3.245 bln
27.57%
jan 1, 2007
17.504 bln
+2.489 bln
16.58%
jan 1, 2008
22.767 bln
+5.263 bln
30.07%
jan 1, 2009
27.439 bln
+4.672 bln
20.52%
jan 1, 2010
27.5 bln
+61.784 mln
0.23%
jan 1, 2011
29.161 bln
+1.66 bln
6.04%
jan 1, 2012
41.72 bln
+12.559 bln
43.07%
jan 1, 2013
48.072 bln
+6.352 bln
15.23%
jan 1, 2014
47.958 bln
-113.681 mln
-0.24%
jan 1, 2015
59.5 bln
+11.542 bln
24.07%
jan 1, 2016
81.052 bln
+21.551 bln
36.22%
Ranking of countries by current statistics by years


Comments: