29
/
en
AIzaSyAYiBZKx7MnpbEhh9jyipgxe19OcubqV5w
April 1, 2024
117976
Czech Republic
CZE
true
2
1
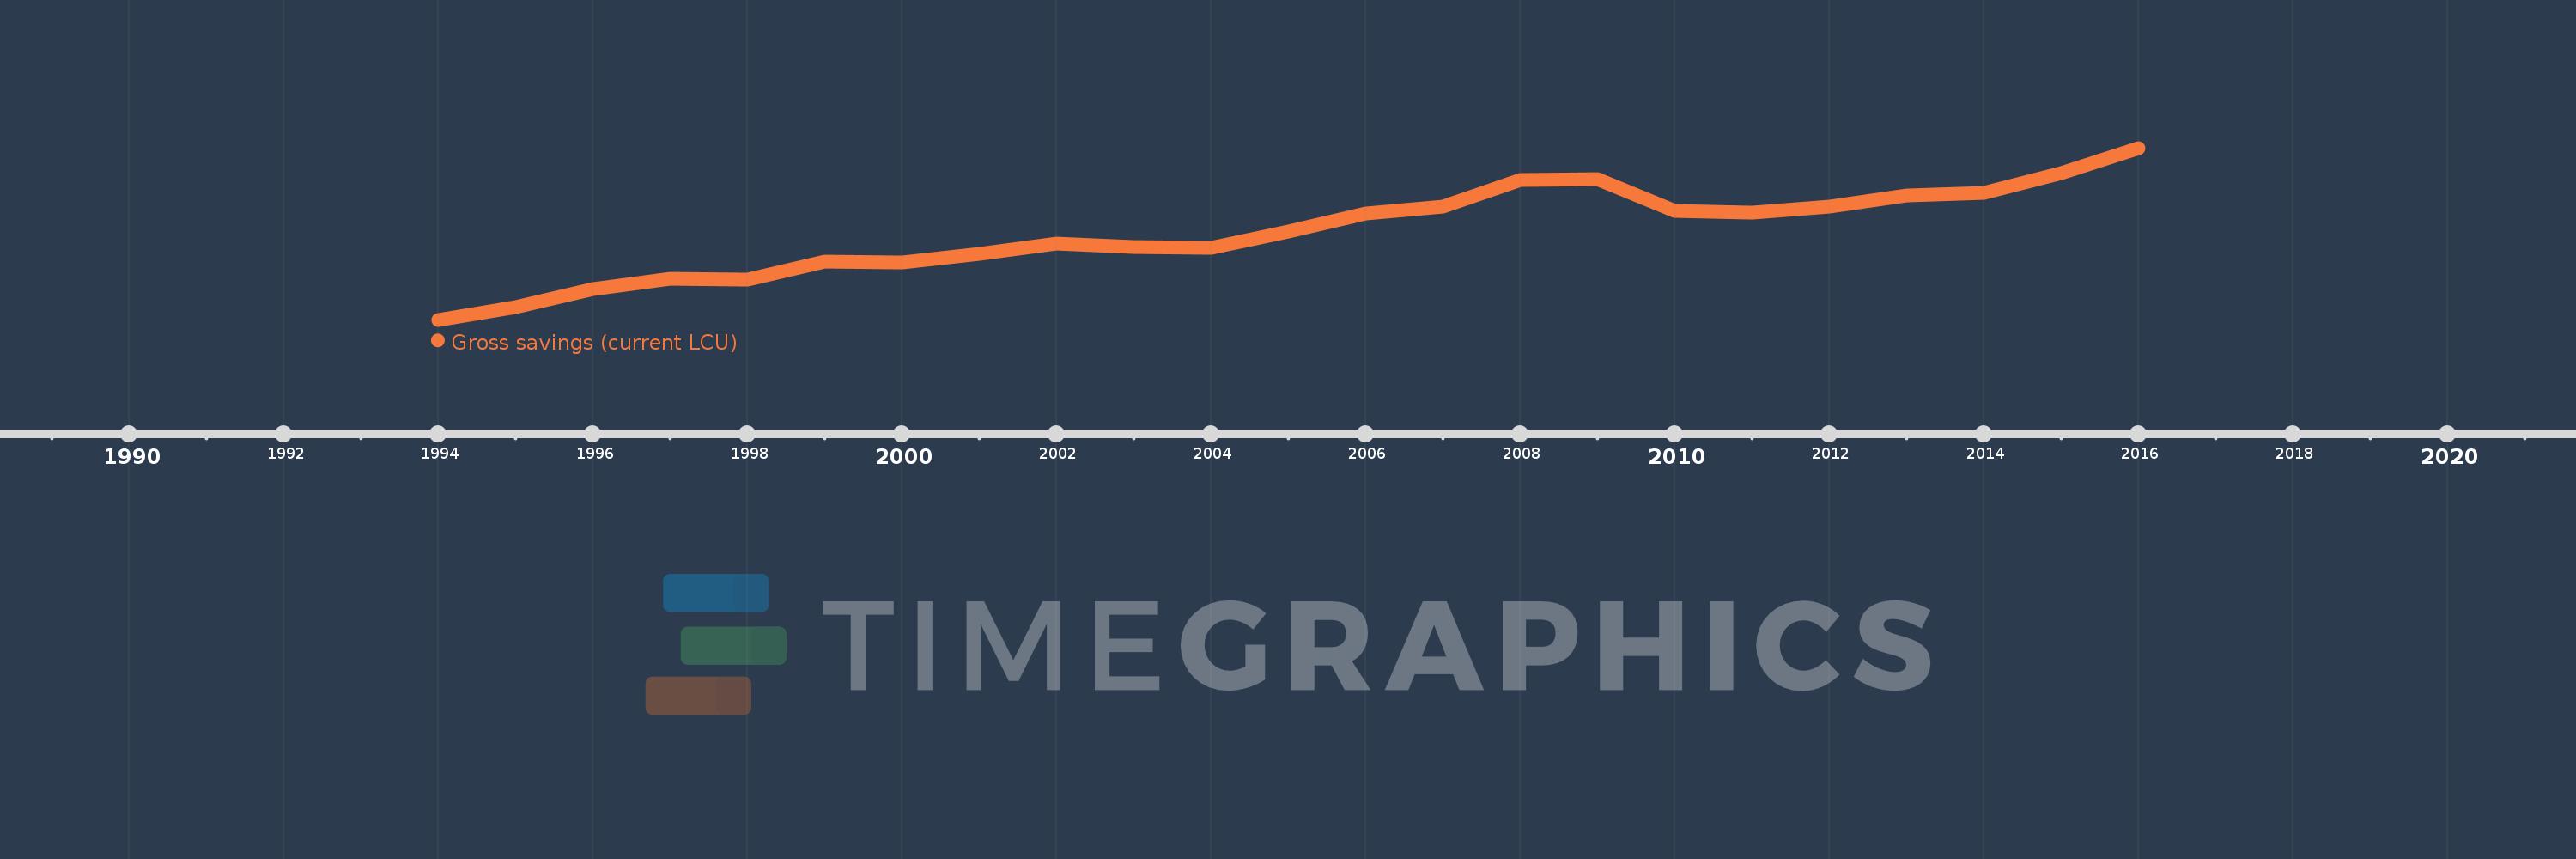
Gross savings (current LCU)
2016,2015,2014,2013,2012,2011,2010,2009,2008,2007,2006,2005,2004,2003,2002,2001,2000,1999,1998,1997,1996,1995,1994
This statistics in other country:
AfghanistanAlbaniaAlgeriaAngolaAntigua and BarbudaArgentinaArmeniaAustraliaAustriaAzerbaijanBahamas, TheBahrainBangladeshBarbadosBelarusBelgiumBelizeBeninBermudaBhutanBoliviaBosnia and HerzegovinaBotswanaBrazilBrunei DarussalamBulgariaBurkina FasoBurundiCabo VerdeCambodiaCameroonCanadaCentral African RepublicChadChileChinaColombiaComorosCongo, Dem. Rep.Congo, Rep.Costa RicaCote d'IvoireCroatiaCyprusCzech RepublicDenmarkDjiboutiDominicaDominican RepublicEcuadorEgypt, Arab Rep.El SalvadorEquatorial GuineaEritreaEstoniaEthiopiaFaroe IslandsFijiFinlandFranceGabonGambia, TheGeorgiaGermanyGhanaGreeceGrenadaGuatemalaGuineaGuinea-BissauGuyanaHaitiHondurasHong Kong SAR, ChinaHungaryIcelandIndiaIndonesiaIran, Islamic Rep.IraqIrelandIsraelItalyJamaicaJapanJordanKazakhstanKenyaKiribatiKorea, Rep.KosovoKuwaitKyrgyz RepublicLao PDRLatviaLebanonLesothoLiberiaLibyaLithuaniaLuxembourgMacao SAR, ChinaMacedonia, FYRMadagascarMalawiMalaysiaMaldivesMaliMaltaMauritaniaMauritiusMexicoMoldovaMongoliaMontenegroMoroccoMozambiqueNamibiaNepalNetherlandsNew ZealandNicaraguaNigerNigeriaNorwayOmanPakistanPanamaPapua New GuineaParaguayPeruPhilippinesPolandPortugalQatarRomaniaRussian FederationRwandaSaudi ArabiaSenegalSerbiaSeychellesSierra LeoneSingaporeSlovak RepublicSloveniaSolomon IslandsSouth AfricaSouth SudanSpainSri LankaSt. Kitts and NevisSt. LuciaSt. Vincent and the GrenadinesSudanSurinameSwazilandSwedenSwitzerlandSyrian Arab RepublicTajikistanTanzaniaThailandTimor-LesteTogoTongaTrinidad and TobagoTunisiaTurkeyUgandaUkraineUnited KingdomUnited StatesUruguayVanuatuVenezuela, RBVietnamWest Bank and GazaYemen, Rep.ZambiaZimbabwe Timeline:
This timeline shows a graph from 1994 to 2016 of Czech Republic. No data until 1993. Number of actual observations by date: 23.
Source name:
World Development Indicators
Source organization:
World Bank national accounts data, and OECD National Accounts data files.
Categories, topics:
Economy & Growth
Last updated:
apr 23, 2017
Indicators value changes by year
Minimum:
329.491 bln
jan 1, 1994
Maximum:
1.225 trl
jan 1, 2016
At the date of observation
Value
Absolute change
Change from previous value
jan 1, 1994
329.491 bln
+329.491 bln
0.0%
jan 1, 1995
395.773 bln
+66.282 bln
20.12%
jan 1, 1996
489.549 bln
+93.776 bln
23.69%
jan 1, 1997
544.795 bln
+55.246 bln
11.29%
jan 1, 1998
537.459 bln
-7.336 bln
-1.35%
jan 1, 1999
632.462 bln
+95.003 bln
17.68%
jan 1, 2000
625.931 bln
-6.531 bln
-1.03%
jan 1, 2001
674.296 bln
+48.365 bln
7.73%
jan 1, 2002
726.064 bln
+51.768 bln
7.68%
jan 1, 2003
710.757 bln
-15.308 bln
-2.11%
jan 1, 2004
705.714 bln
-5.043 bln
-0.71%
jan 1, 2005
788.724 bln
+83.011 bln
11.76%
jan 1, 2006
884.528 bln
+95.804 bln
12.15%
jan 1, 2007
920.343 bln
+35.814 bln
4.05%
jan 1, 2008
1.058 trl
+137.595 bln
14.95%
jan 1, 2009
1.064 trl
+6.166 bln
0.58%
jan 1, 2010
896.021 bln
-168.082 bln
-15.8%
jan 1, 2011
888.564 bln
-7.457 bln
-0.83%
jan 1, 2012
918.486 bln
+29.921 bln
3.37%
jan 1, 2013
979.142 bln
+60.656 bln
6.6%
jan 1, 2014
992.337 bln
+13.195 bln
1.35%
jan 1, 2015
1.092 trl
+99.793 bln
10.06%
jan 1, 2016
1.225 trl
+132.944 bln
12.17%
Ranking of countries by current statistics by years


Comments: