29
/
en
AIzaSyAYiBZKx7MnpbEhh9jyipgxe19OcubqV5w
April 1, 2024
223642
Philippines
PHL
true
2
1
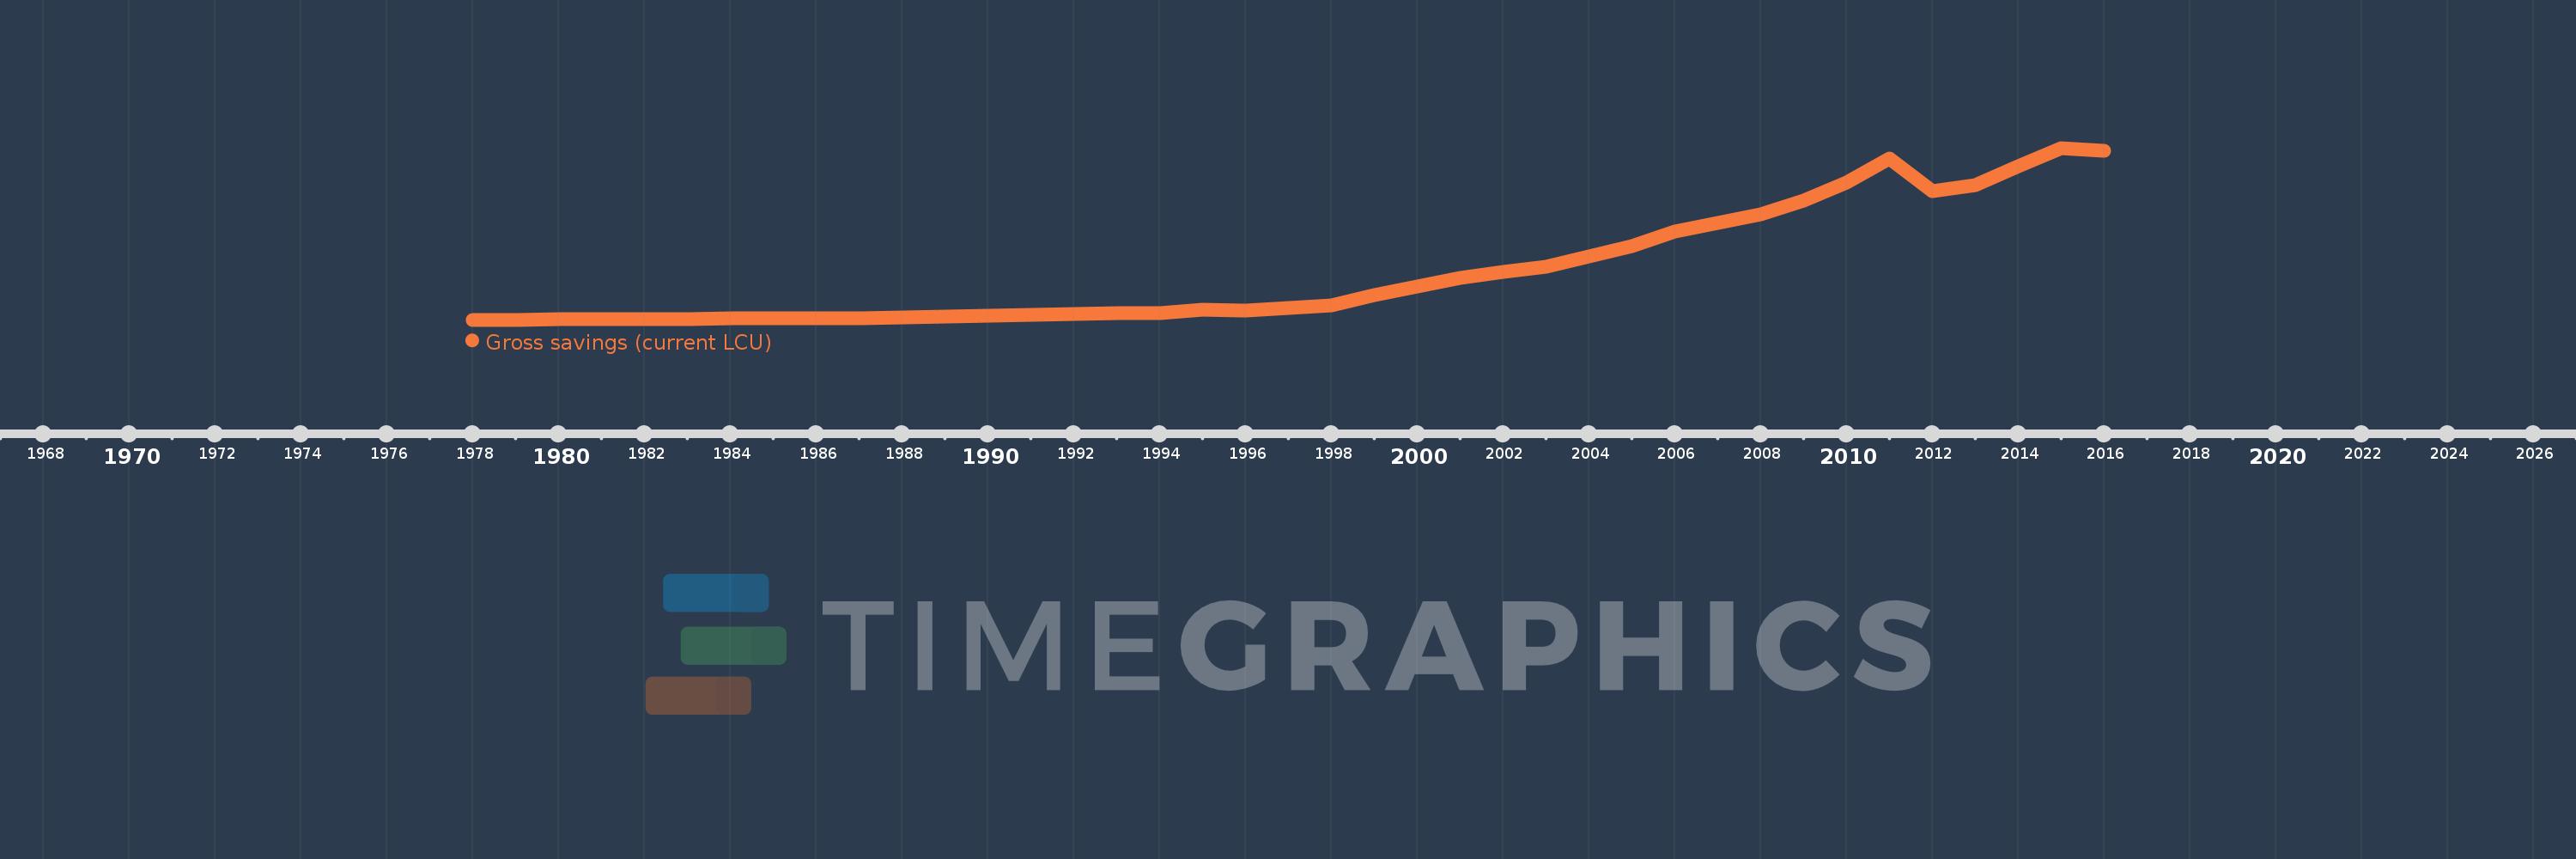
Gross savings (current LCU)
2016,2015,2014,2013,2012,2011,2010,2009,2008,2007,2006,2005,2004,2003,2002,2001,2000,1999,1998,1997,1996,1995,1994,1993,1992,1991,1990,1989,1988,1987,1986,1985,1984,1983,1982,1981,1980,1979,1978
This statistics in other country:
AfghanistanAlbaniaAlgeriaAngolaAntigua and BarbudaArgentinaArmeniaAustraliaAustriaAzerbaijanBahamas, TheBahrainBangladeshBarbadosBelarusBelgiumBelizeBeninBermudaBhutanBoliviaBosnia and HerzegovinaBotswanaBrazilBrunei DarussalamBulgariaBurkina FasoBurundiCabo VerdeCambodiaCameroonCanadaCentral African RepublicChadChileChinaColombiaComorosCongo, Dem. Rep.Congo, Rep.Costa RicaCote d'IvoireCroatiaCyprusCzech RepublicDenmarkDjiboutiDominicaDominican RepublicEcuadorEgypt, Arab Rep.El SalvadorEquatorial GuineaEritreaEstoniaEthiopiaFaroe IslandsFijiFinlandFranceGabonGambia, TheGeorgiaGermanyGhanaGreeceGrenadaGuatemalaGuineaGuinea-BissauGuyanaHaitiHondurasHong Kong SAR, ChinaHungaryIcelandIndiaIndonesiaIran, Islamic Rep.IraqIrelandIsraelItalyJamaicaJapanJordanKazakhstanKenyaKiribatiKorea, Rep.KosovoKuwaitKyrgyz RepublicLao PDRLatviaLebanonLesothoLiberiaLibyaLithuaniaLuxembourgMacao SAR, ChinaMacedonia, FYRMadagascarMalawiMalaysiaMaldivesMaliMaltaMauritaniaMauritiusMexicoMoldovaMongoliaMontenegroMoroccoMozambiqueNamibiaNepalNetherlandsNew ZealandNicaraguaNigerNigeriaNorwayOmanPakistanPanamaPapua New GuineaParaguayPeruPhilippinesPolandPortugalQatarRomaniaRussian FederationRwandaSaudi ArabiaSenegalSerbiaSeychellesSierra LeoneSingaporeSlovak RepublicSloveniaSolomon IslandsSouth AfricaSouth SudanSpainSri LankaSt. Kitts and NevisSt. LuciaSt. Vincent and the GrenadinesSudanSurinameSwazilandSwedenSwitzerlandSyrian Arab RepublicTajikistanTanzaniaThailandTimor-LesteTogoTongaTrinidad and TobagoTunisiaTurkeyUgandaUkraineUnited KingdomUnited StatesUruguayVanuatuVenezuela, RBVietnamWest Bank and GazaYemen, Rep.ZambiaZimbabwe Timeline:
This timeline shows a graph from 1978 to 2016 of Philippines. No data until 1977. Number of actual observations by date: 39.
Source name:
World Development Indicators
Source organization:
World Bank national accounts data, and OECD National Accounts data files.
Categories, topics:
Economy & Growth
Last updated:
apr 23, 2017
Indicators value changes by year
Minimum:
40.953 bln
jan 1, 1978
Maximum:
5.816 trl
jan 1, 2015
At the date of observation
Value
Absolute change
Change from previous value
jan 1, 1978
40.953 bln
+40.953 bln
0.0%
jan 1, 1979
45.679 bln
+4.725 bln
11.54%
jan 1, 1980
53.23 bln
+7.551 bln
16.53%
jan 1, 1981
59.018 bln
+5.788 bln
10.87%
jan 1, 1982
67.777 bln
+8.759 bln
14.84%
jan 1, 1983
65.248 bln
-2.529 bln
-3.73%
jan 1, 1984
80.046 bln
+14.799 bln
22.68%
jan 1, 1985
83.032 bln
+2.986 bln
3.73%
jan 1, 1986
76.711 bln
-6.321 bln
-7.61%
jan 1, 1987
98.871 bln
+22.16 bln
28.89%
jan 1, 1988
109.021 bln
+10.15 bln
10.27%
jan 1, 1989
151.593 bln
+42.571 bln
39.05%
jan 1, 1990
165.662 bln
+14.069 bln
9.28%
jan 1, 1991
197.303 bln
+31.641 bln
19.1%
jan 1, 1992
232.015 bln
+34.713 bln
17.59%
jan 1, 1993
257.965 bln
+25.949 bln
11.18%
jan 1, 1994
273.06 bln
+15.095 bln
5.85%
jan 1, 1995
374.172 bln
+101.113 bln
37.03%
jan 1, 1996
361.318 bln
-12.854 bln
-3.44%
jan 1, 1997
432.247 bln
+70.929 bln
19.63%
jan 1, 1998
520.164 bln
+87.917 bln
20.34%
jan 1, 1999
863.875 bln
+343.711 bln
66.08%
jan 1, 2000
1.161 trl
+297.532 bln
34.44%
jan 1, 2001
1.452 trl
+290.52 bln
25.01%
jan 1, 2002
1.649 trl
+197.492 bln
13.6%
jan 1, 2003
1.829 trl
+179.687 bln
10.89%
jan 1, 2004
2.18 trl
+350.731 bln
19.18%
jan 1, 2005
2.523 trl
+343.288 bln
15.75%
jan 1, 2006
3.019 trl
+495.691 bln
19.65%
jan 1, 2007
3.309 trl
+290.156 bln
9.61%
jan 1, 2008
3.596 trl
+287.356 bln
8.68%
jan 1, 2009
4.051 trl
+455.093 bln
12.65%
jan 1, 2010
4.658 trl
+606.254 bln
14.96%
jan 1, 2011
5.472 trl
+814.819 bln
17.49%
jan 1, 2012
4.359 trl
-1.113 trl
-20.35%
jan 1, 2013
4.568 trl
+208.585 bln
4.79%
jan 1, 2014
5.199 trl
+631.169 bln
13.82%
jan 1, 2015
5.816 trl
+617.226 bln
11.87%
jan 1, 2016
5.708 trl
-107.719 bln
-1.85%
Ranking of countries by current statistics by years


Comments: