29
/
en
AIzaSyAYiBZKx7MnpbEhh9jyipgxe19OcubqV5w
April 1, 2024
262322
Thailand
THA
true
2
1
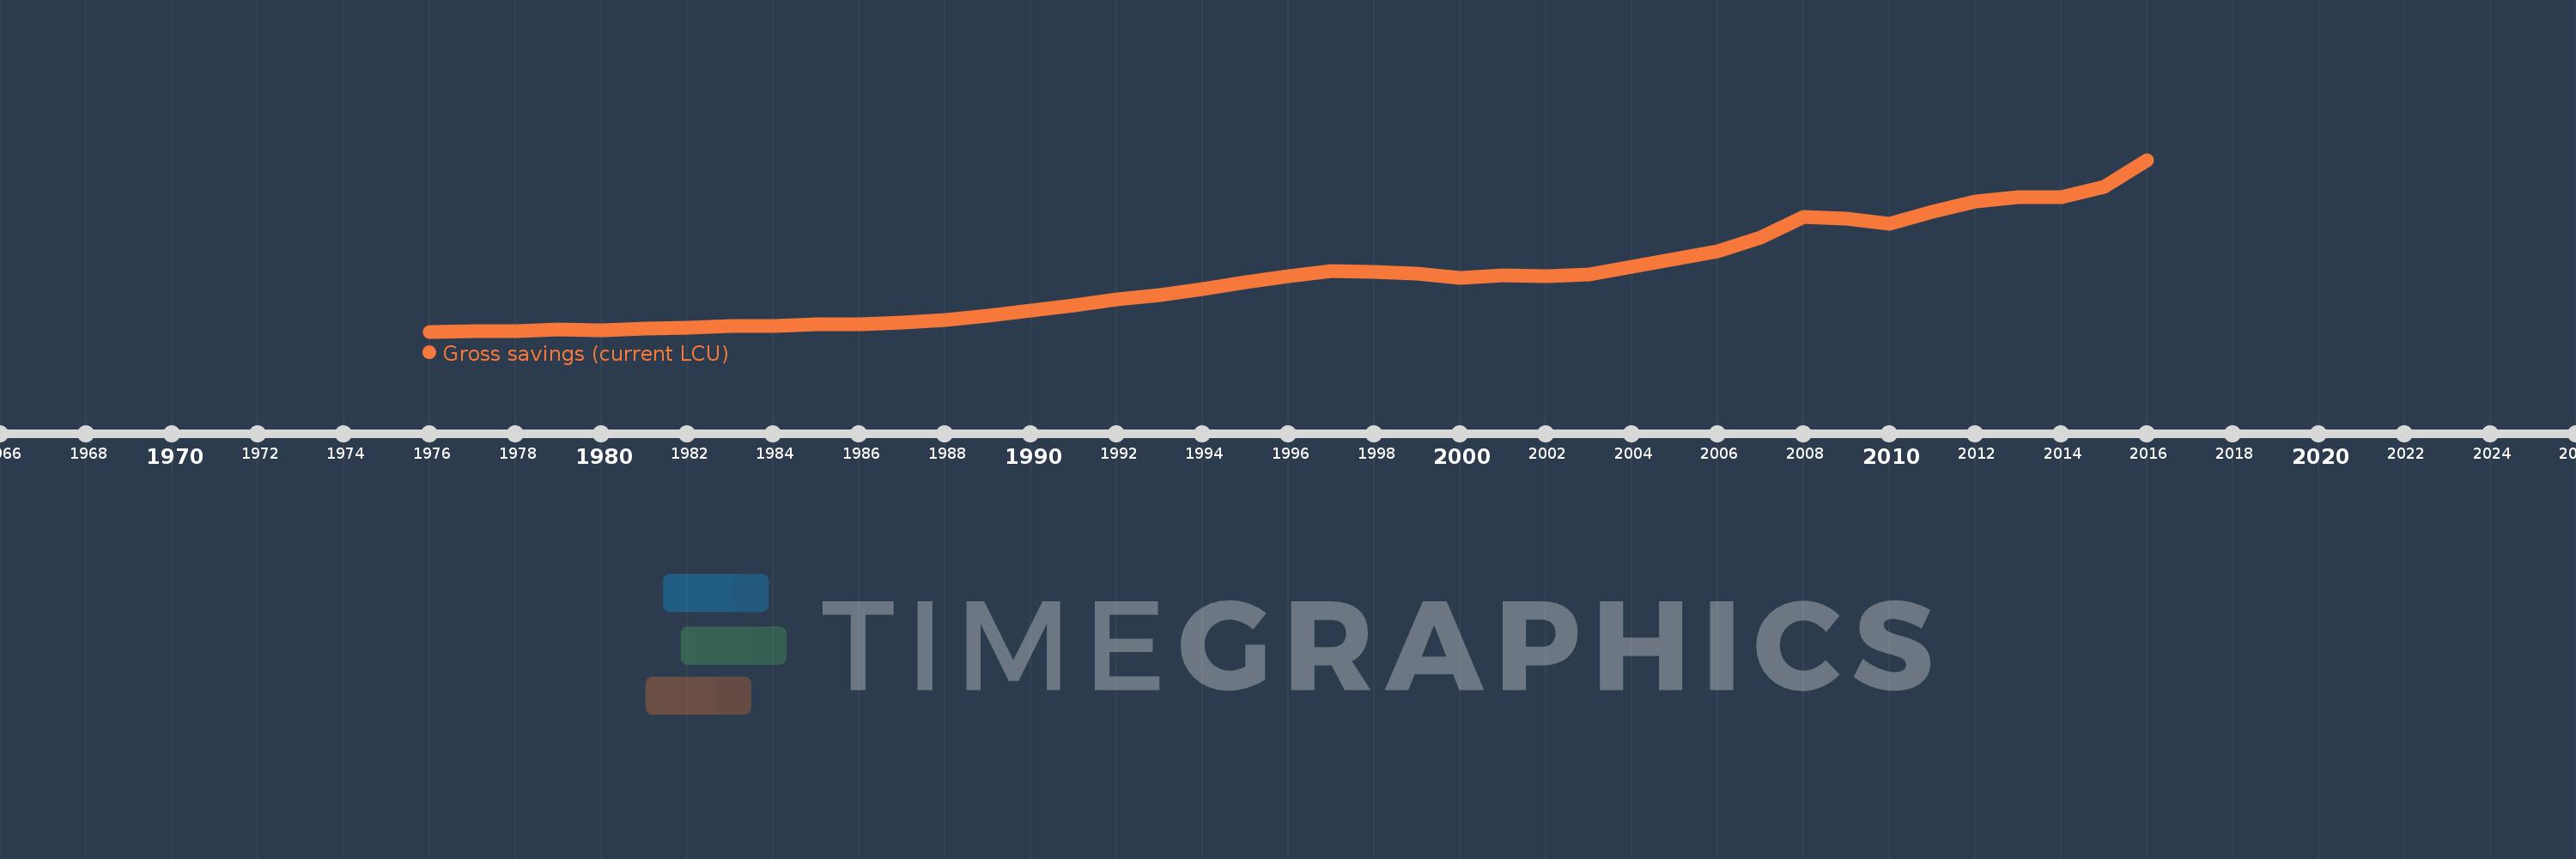
Gross savings (current LCU)
2016,2015,2014,2013,2012,2011,2010,2009,2008,2007,2006,2005,2004,2003,2002,2001,2000,1999,1998,1997,1996,1995,1994,1993,1992,1991,1990,1989,1988,1987,1986,1985,1984,1983,1982,1981,1980,1979,1978,1977,1976
This statistics in other country:
AfghanistanAlbaniaAlgeriaAngolaAntigua and BarbudaArgentinaArmeniaAustraliaAustriaAzerbaijanBahamas, TheBahrainBangladeshBarbadosBelarusBelgiumBelizeBeninBermudaBhutanBoliviaBosnia and HerzegovinaBotswanaBrazilBrunei DarussalamBulgariaBurkina FasoBurundiCabo VerdeCambodiaCameroonCanadaCentral African RepublicChadChileChinaColombiaComorosCongo, Dem. Rep.Congo, Rep.Costa RicaCote d'IvoireCroatiaCyprusCzech RepublicDenmarkDjiboutiDominicaDominican RepublicEcuadorEgypt, Arab Rep.El SalvadorEquatorial GuineaEritreaEstoniaEthiopiaFaroe IslandsFijiFinlandFranceGabonGambia, TheGeorgiaGermanyGhanaGreeceGrenadaGuatemalaGuineaGuinea-BissauGuyanaHaitiHondurasHong Kong SAR, ChinaHungaryIcelandIndiaIndonesiaIran, Islamic Rep.IraqIrelandIsraelItalyJamaicaJapanJordanKazakhstanKenyaKiribatiKorea, Rep.KosovoKuwaitKyrgyz RepublicLao PDRLatviaLebanonLesothoLiberiaLibyaLithuaniaLuxembourgMacao SAR, ChinaMacedonia, FYRMadagascarMalawiMalaysiaMaldivesMaliMaltaMauritaniaMauritiusMexicoMoldovaMongoliaMontenegroMoroccoMozambiqueNamibiaNepalNetherlandsNew ZealandNicaraguaNigerNigeriaNorwayOmanPakistanPanamaPapua New GuineaParaguayPeruPhilippinesPolandPortugalQatarRomaniaRussian FederationRwandaSaudi ArabiaSenegalSerbiaSeychellesSierra LeoneSingaporeSlovak RepublicSloveniaSolomon IslandsSouth AfricaSouth SudanSpainSri LankaSt. Kitts and NevisSt. LuciaSt. Vincent and the GrenadinesSudanSurinameSwazilandSwedenSwitzerlandSyrian Arab RepublicTajikistanTanzaniaThailandTimor-LesteTogoTongaTrinidad and TobagoTunisiaTurkeyUgandaUkraineUnited KingdomUnited StatesUruguayVanuatuVenezuela, RBVietnamWest Bank and GazaYemen, Rep.ZambiaZimbabwe Timeline:
This timeline shows a graph from 1976 to 2016 of Thailand. No data until 1975. Number of actual observations by date: 41.
Source name:
World Development Indicators
Source organization:
World Bank national accounts data, and OECD National Accounts data files.
Categories, topics:
Economy & Growth
Last updated:
apr 23, 2017
Indicators value changes by year
Minimum:
68.79 bln
jan 1, 1976
Maximum:
4.345 trl
jan 1, 2016
At the date of observation
Value
Absolute change
Change from previous value
jan 1, 1976
68.79 bln
+68.79 bln
0.0%
jan 1, 1977
74.607 bln
+5.817 bln
8.46%
jan 1, 1978
86.219 bln
+11.612 bln
15.56%
jan 1, 1979
114.073 bln
+27.854 bln
32.31%
jan 1, 1980
109.362 bln
-4.711 bln
-4.13%
jan 1, 1981
150.523 bln
+41.161 bln
37.64%
jan 1, 1982
169.554 bln
+19.031 bln
12.64%
jan 1, 1983
200.032 bln
+30.478 bln
17.98%
jan 1, 1984
209.795 bln
+9.763 bln
4.88%
jan 1, 1985
241.744 bln
+31.949 bln
15.23%
jan 1, 1986
256.469 bln
+14.725 bln
6.09%
jan 1, 1987
299.748 bln
+43.279 bln
16.88%
jan 1, 1988
352.989 bln
+53.241 bln
17.76%
jan 1, 1989
467.886 bln
+114.898 bln
32.55%
jan 1, 1990
586.225 bln
+118.339 bln
25.29%
jan 1, 1991
716.827 bln
+130.602 bln
22.28%
jan 1, 1992
879.646 bln
+162.819 bln
22.71%
jan 1, 1993
971.271 bln
+91.625 bln
10.42%
jan 1, 1994
1.124 trl
+152.838 bln
15.74%
jan 1, 1995
1.296 trl
+171.826 bln
15.29%
jan 1, 1996
1.456 trl
+160.214 bln
12.36%
jan 1, 1997
1.586 trl
+129.886 bln
8.92%
jan 1, 1998
1.556 trl
-29.931 bln
-1.89%
jan 1, 1999
1.513 trl
-42.728 bln
-2.75%
jan 1, 2000
1.416 trl
-97.647 bln
-6.45%
jan 1, 2001
1.478 trl
+62.474 bln
4.41%
jan 1, 2002
1.446 trl
-32.453 bln
-2.2%
jan 1, 2003
1.5 trl
+54.323 bln
3.76%
jan 1, 2004
1.687 trl
+187.417 bln
12.49%
jan 1, 2005
1.885 trl
+197.208 bln
11.69%
jan 1, 2006
2.064 trl
+179.321 bln
9.51%
jan 1, 2007
2.409 trl
+344.798 bln
16.71%
jan 1, 2008
2.916 trl
+507.287 bln
21.06%
jan 1, 2009
2.882 trl
-34.447 bln
-1.18%
jan 1, 2010
2.742 trl
-139.901 bln
-4.85%
jan 1, 2011
3.056 trl
+314.597 bln
11.47%
jan 1, 2012
3.308 trl
+251.276 bln
8.22%
jan 1, 2013
3.424 trl
+116.484 bln
3.52%
jan 1, 2014
3.409 trl
-15.479 bln
-0.45%
jan 1, 2015
3.662 trl
+253.516 bln
7.44%
jan 1, 2016
4.345 trl
+683.151 bln
18.65%
Ranking of countries by current statistics by years


Comments: