29
/
en
AIzaSyAYiBZKx7MnpbEhh9jyipgxe19OcubqV5w
April 1, 2024
131484
Faroe Islands
FRO
true
2
1
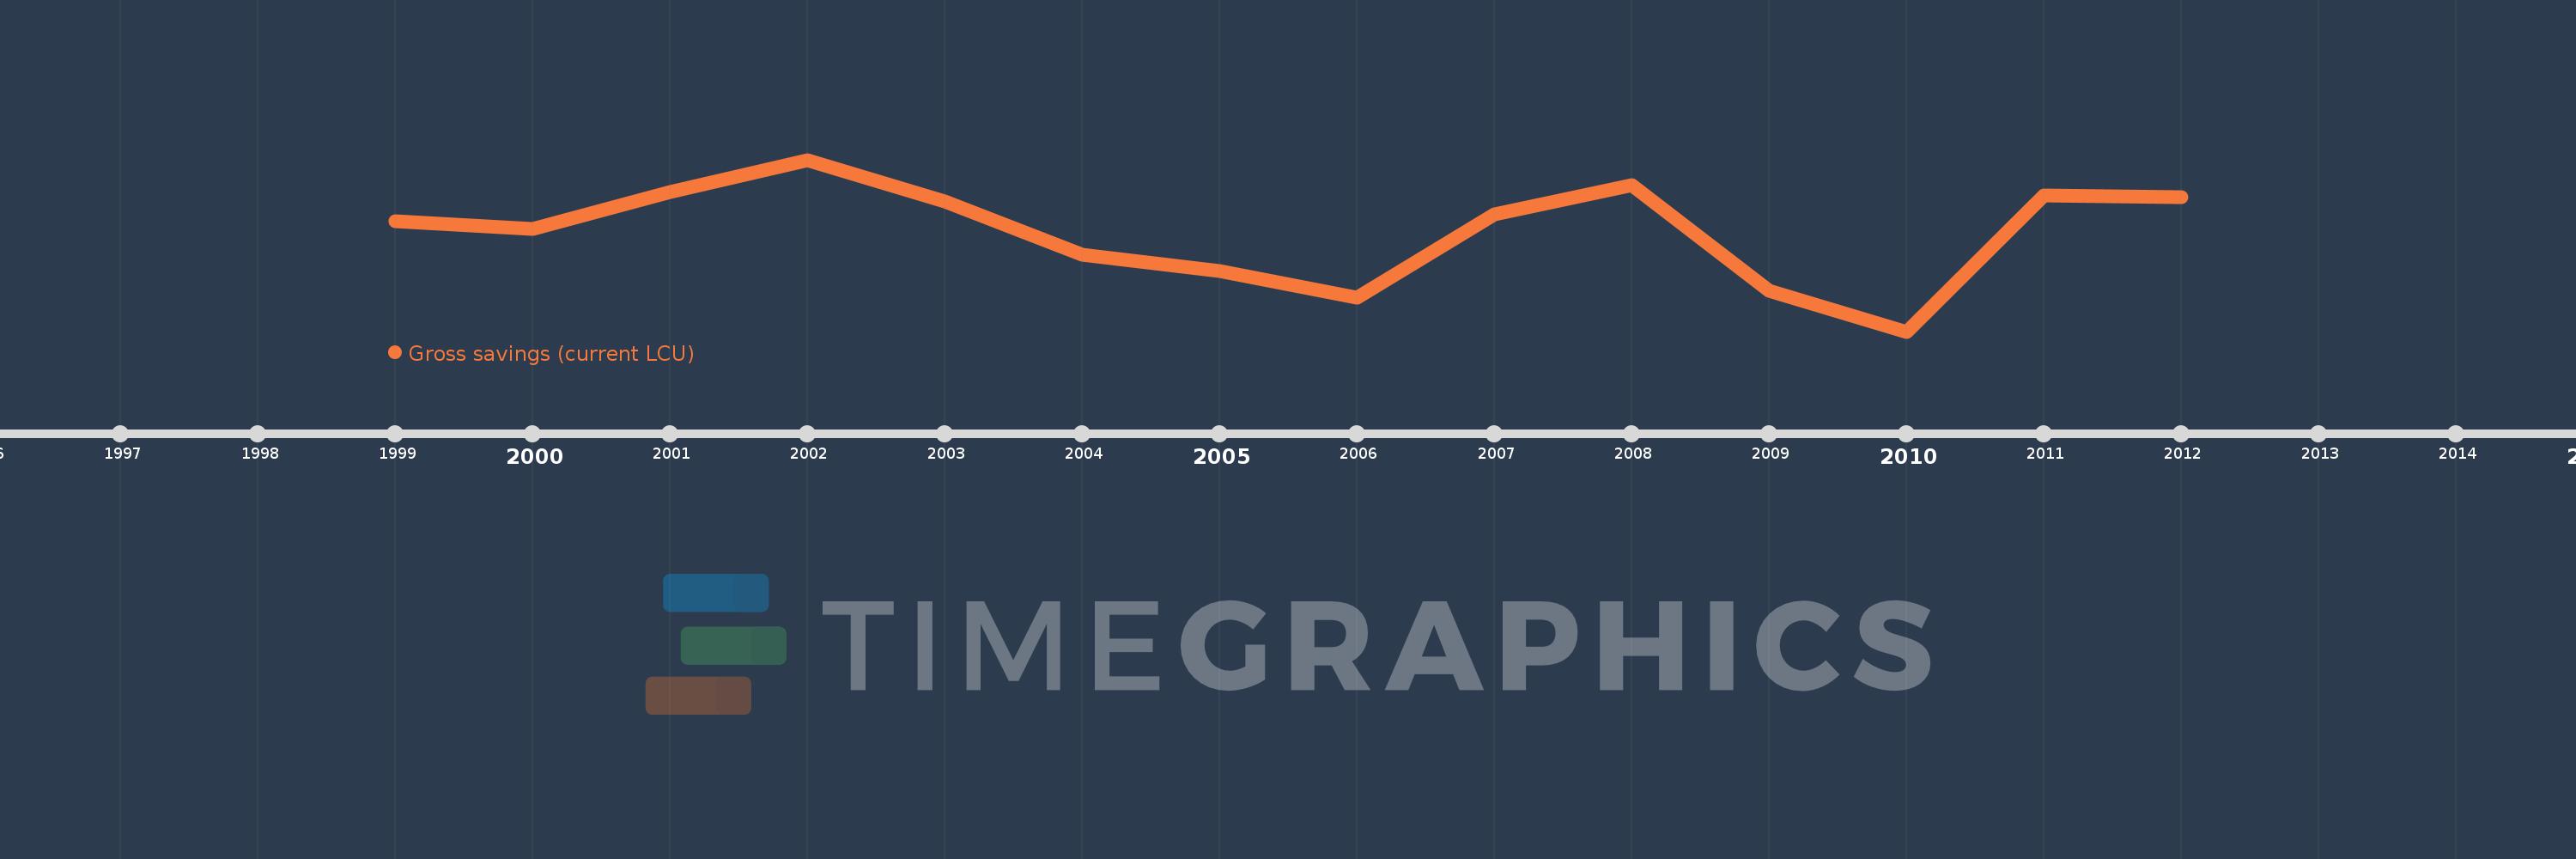
Gross savings (current LCU)
2012,2011,2010,2009,2008,2007,2006,2005,2004,2003,2002,2001,2000,1999
This statistics in other country:
AfghanistanAlbaniaAlgeriaAngolaAntigua and BarbudaArgentinaArmeniaAustraliaAustriaAzerbaijanBahamas, TheBahrainBangladeshBarbadosBelarusBelgiumBelizeBeninBermudaBhutanBoliviaBosnia and HerzegovinaBotswanaBrazilBrunei DarussalamBulgariaBurkina FasoBurundiCabo VerdeCambodiaCameroonCanadaCentral African RepublicChadChileChinaColombiaComorosCongo, Dem. Rep.Congo, Rep.Costa RicaCote d'IvoireCroatiaCyprusCzech RepublicDenmarkDjiboutiDominicaDominican RepublicEcuadorEgypt, Arab Rep.El SalvadorEquatorial GuineaEritreaEstoniaEthiopiaFaroe IslandsFijiFinlandFranceGabonGambia, TheGeorgiaGermanyGhanaGreeceGrenadaGuatemalaGuineaGuinea-BissauGuyanaHaitiHondurasHong Kong SAR, ChinaHungaryIcelandIndiaIndonesiaIran, Islamic Rep.IraqIrelandIsraelItalyJamaicaJapanJordanKazakhstanKenyaKiribatiKorea, Rep.KosovoKuwaitKyrgyz RepublicLao PDRLatviaLebanonLesothoLiberiaLibyaLithuaniaLuxembourgMacao SAR, ChinaMacedonia, FYRMadagascarMalawiMalaysiaMaldivesMaliMaltaMauritaniaMauritiusMexicoMoldovaMongoliaMontenegroMoroccoMozambiqueNamibiaNepalNetherlandsNew ZealandNicaraguaNigerNigeriaNorwayOmanPakistanPanamaPapua New GuineaParaguayPeruPhilippinesPolandPortugalQatarRomaniaRussian FederationRwandaSaudi ArabiaSenegalSerbiaSeychellesSierra LeoneSingaporeSlovak RepublicSloveniaSolomon IslandsSouth AfricaSouth SudanSpainSri LankaSt. Kitts and NevisSt. LuciaSt. Vincent and the GrenadinesSudanSurinameSwazilandSwedenSwitzerlandSyrian Arab RepublicTajikistanTanzaniaThailandTimor-LesteTogoTongaTrinidad and TobagoTunisiaTurkeyUgandaUkraineUnited KingdomUnited StatesUruguayVanuatuVenezuela, RBVietnamWest Bank and GazaYemen, Rep.ZambiaZimbabwe Timeline:
This timeline shows a graph from 1999 to 2012 of Faroe Islands. No data until 1998. Number of actual observations by date: 14.
Source name:
World Development Indicators
Source organization:
World Bank national accounts data, and OECD National Accounts data files.
Categories, topics:
Economy & Growth
Last updated:
apr 23, 2017
Indicators value changes by year
Minimum:
1.975 bln
jan 1, 2010
Maximum:
3.711 bln
jan 1, 2002
At the date of observation
Value
Absolute change
Change from previous value
jan 1, 1999
3.086 bln
+3.086 bln
0.0%
jan 1, 2000
3.008 bln
-78.177 mln
-2.53%
jan 1, 2001
3.382 bln
+373.679 mln
12.42%
jan 1, 2002
3.711 bln
+329.681 mln
9.75%
jan 1, 2003
3.289 bln
-422.277 mln
-11.38%
jan 1, 2004
2.755 bln
-534.384 mln
-16.25%
jan 1, 2005
2.583 bln
-171.723 mln
-6.23%
jan 1, 2006
2.319 bln
-263.48 mln
-10.2%
jan 1, 2007
3.156 bln
+836.455 mln
36.06%
jan 1, 2008
3.451 bln
+295.549 mln
9.37%
jan 1, 2009
2.388 bln
-1.063 bln
-30.81%
jan 1, 2010
1.975 bln
-413.579 mln
-17.32%
jan 1, 2011
3.347 bln
+1.373 bln
69.53%
jan 1, 2012
3.336 bln
-11.836 mln
-0.35%
Ranking of countries by current statistics by years


Comments: