29
/
en
AIzaSyAYiBZKx7MnpbEhh9jyipgxe19OcubqV5w
April 1, 2024
224924
Poland
POL
true
2
1
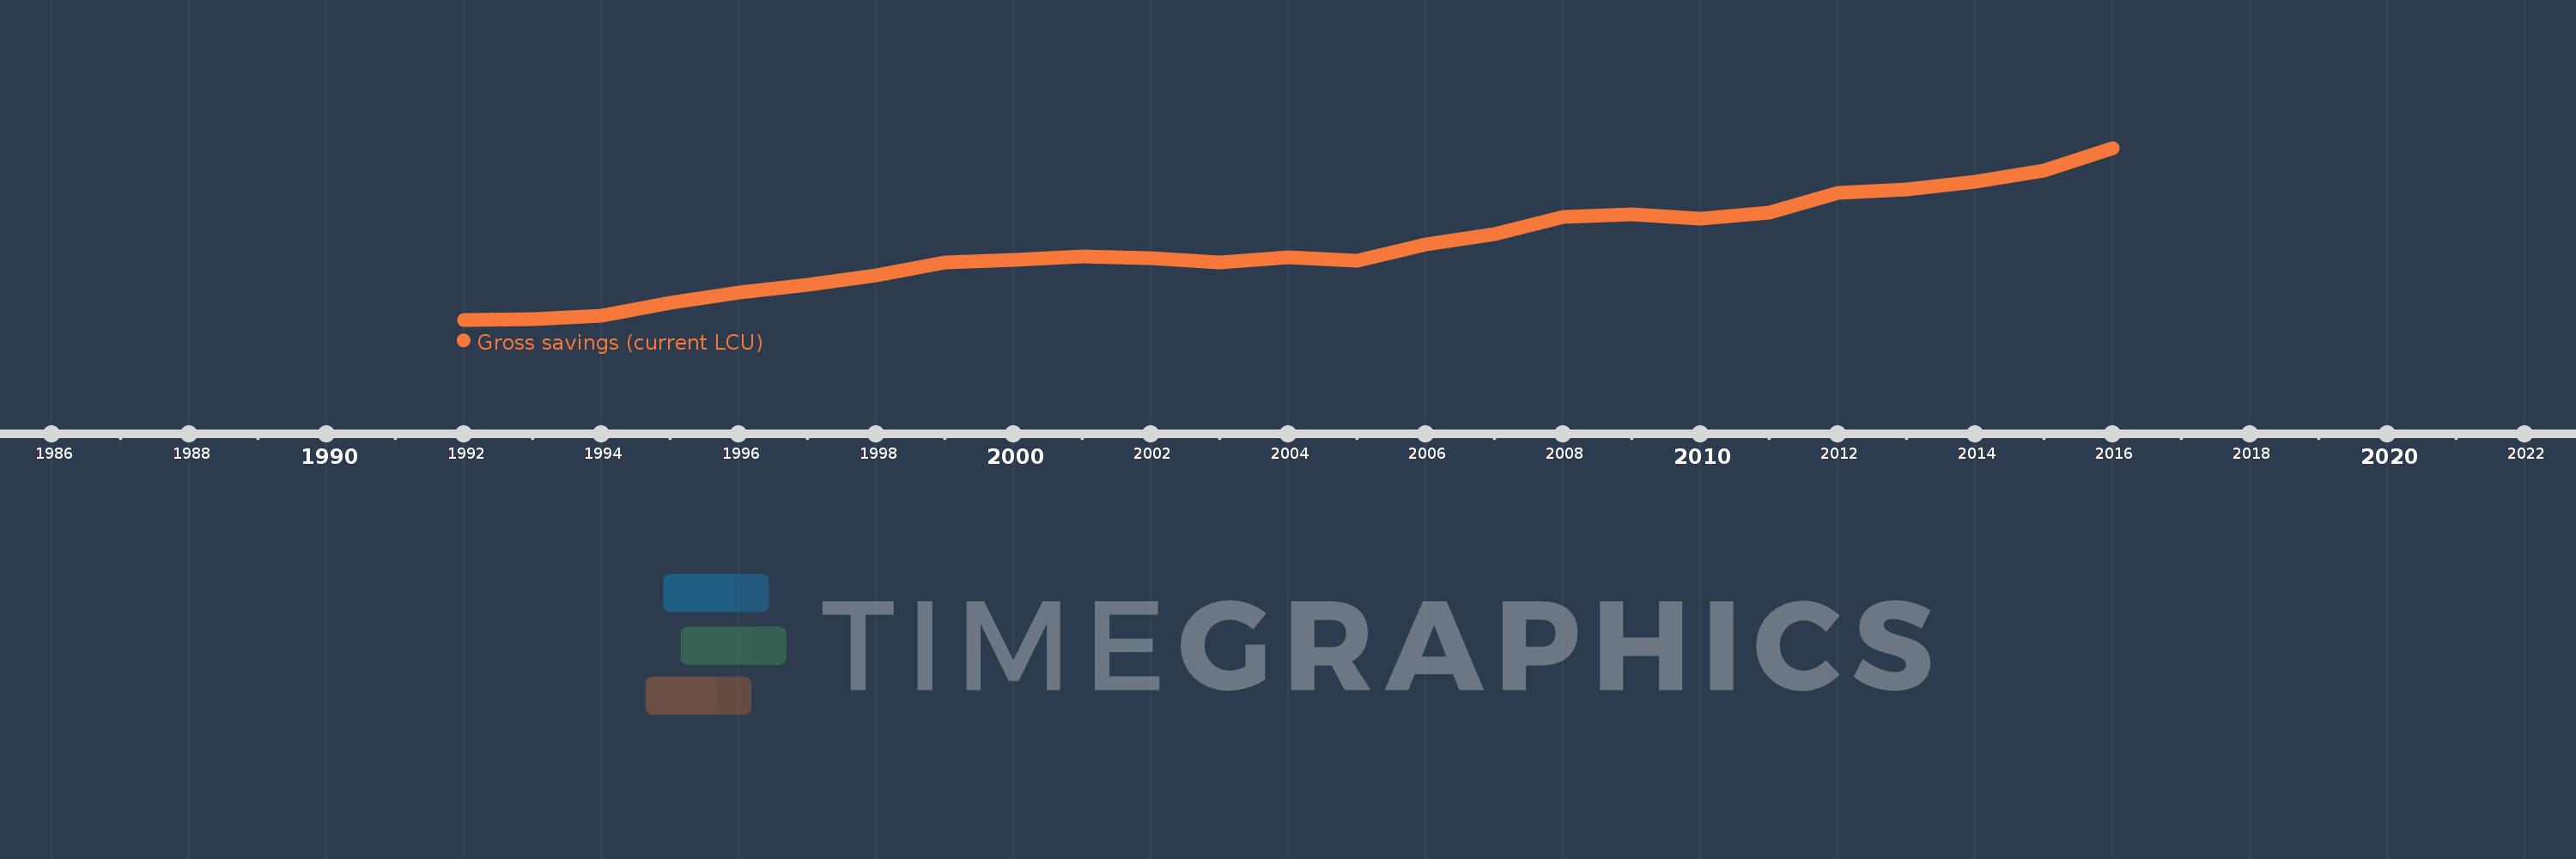
Gross savings (current LCU)
2016,2015,2014,2013,2012,2011,2010,2009,2008,2007,2006,2005,2004,2003,2002,2001,2000,1999,1998,1997,1996,1995,1994,1993,1992
This statistics in other country:
AfghanistanAlbaniaAlgeriaAngolaAntigua and BarbudaArgentinaArmeniaAustraliaAustriaAzerbaijanBahamas, TheBahrainBangladeshBarbadosBelarusBelgiumBelizeBeninBermudaBhutanBoliviaBosnia and HerzegovinaBotswanaBrazilBrunei DarussalamBulgariaBurkina FasoBurundiCabo VerdeCambodiaCameroonCanadaCentral African RepublicChadChileChinaColombiaComorosCongo, Dem. Rep.Congo, Rep.Costa RicaCote d'IvoireCroatiaCyprusCzech RepublicDenmarkDjiboutiDominicaDominican RepublicEcuadorEgypt, Arab Rep.El SalvadorEquatorial GuineaEritreaEstoniaEthiopiaFaroe IslandsFijiFinlandFranceGabonGambia, TheGeorgiaGermanyGhanaGreeceGrenadaGuatemalaGuineaGuinea-BissauGuyanaHaitiHondurasHong Kong SAR, ChinaHungaryIcelandIndiaIndonesiaIran, Islamic Rep.IraqIrelandIsraelItalyJamaicaJapanJordanKazakhstanKenyaKiribatiKorea, Rep.KosovoKuwaitKyrgyz RepublicLao PDRLatviaLebanonLesothoLiberiaLibyaLithuaniaLuxembourgMacao SAR, ChinaMacedonia, FYRMadagascarMalawiMalaysiaMaldivesMaliMaltaMauritaniaMauritiusMexicoMoldovaMongoliaMontenegroMoroccoMozambiqueNamibiaNepalNetherlandsNew ZealandNicaraguaNigerNigeriaNorwayOmanPakistanPanamaPapua New GuineaParaguayPeruPhilippinesPolandPortugalQatarRomaniaRussian FederationRwandaSaudi ArabiaSenegalSerbiaSeychellesSierra LeoneSingaporeSlovak RepublicSloveniaSolomon IslandsSouth AfricaSouth SudanSpainSri LankaSt. Kitts and NevisSt. LuciaSt. Vincent and the GrenadinesSudanSurinameSwazilandSwedenSwitzerlandSyrian Arab RepublicTajikistanTanzaniaThailandTimor-LesteTogoTongaTrinidad and TobagoTunisiaTurkeyUgandaUkraineUnited KingdomUnited StatesUruguayVanuatuVenezuela, RBVietnamWest Bank and GazaYemen, Rep.ZambiaZimbabwe Timeline:
This timeline shows a graph from 1992 to 2016 of Poland. No data until 1991. Number of actual observations by date: 25.
Source name:
World Development Indicators
Source organization:
World Bank national accounts data, and OECD National Accounts data files.
Categories, topics:
Economy & Growth
Last updated:
apr 23, 2017
Indicators value changes by year
Minimum:
12.504 bln
jan 1, 1992
Maximum:
357.381 bln
jan 1, 2016
At the date of observation
Value
Absolute change
Change from previous value
jan 1, 1992
12.504 bln
+12.504 bln
0.0%
jan 1, 1993
13.887 bln
+1.383 bln
11.06%
jan 1, 1994
20.261 bln
+6.374 bln
45.9%
jan 1, 1995
45.64 bln
+25.379 bln
125.26%
jan 1, 1996
66.753 bln
+21.113 bln
46.26%
jan 1, 1997
82.445 bln
+15.692 bln
23.51%
jan 1, 1998
102.302 bln
+19.856 bln
24.08%
jan 1, 1999
127.1 bln
+24.798 bln
24.24%
jan 1, 2000
132.363 bln
+5.263 bln
4.14%
jan 1, 2001
139.623 bln
+7.26 bln
5.49%
jan 1, 2002
136.551 bln
-3.072 bln
-2.2%
jan 1, 2003
127.284 bln
-9.267 bln
-6.79%
jan 1, 2004
138.268 bln
+10.984 bln
8.63%
jan 1, 2005
130.859 bln
-7.409 bln
-5.36%
jan 1, 2006
164.559 bln
+33.7 bln
25.75%
jan 1, 2007
185.07 bln
+20.511 bln
12.46%
jan 1, 2008
219.664 bln
+34.594 bln
18.69%
jan 1, 2009
224.389 bln
+4.725 bln
2.15%
jan 1, 2010
214.664 bln
-9.725 bln
-4.33%
jan 1, 2011
227.262 bln
+12.598 bln
5.87%
jan 1, 2012
267.85 bln
+40.588 bln
17.86%
jan 1, 2013
273.476 bln
+5.626 bln
2.1%
jan 1, 2014
289.537 bln
+16.061 bln
5.87%
jan 1, 2015
312.701 bln
+23.164 bln
8.0%
jan 1, 2016
357.381 bln
+44.68 bln
14.29%
Ranking of countries by current statistics by years


Comments: