29
/
en
AIzaSyAYiBZKx7MnpbEhh9jyipgxe19OcubqV5w
April 1, 2024
112325
Costa Rica
CRI
true
2
1
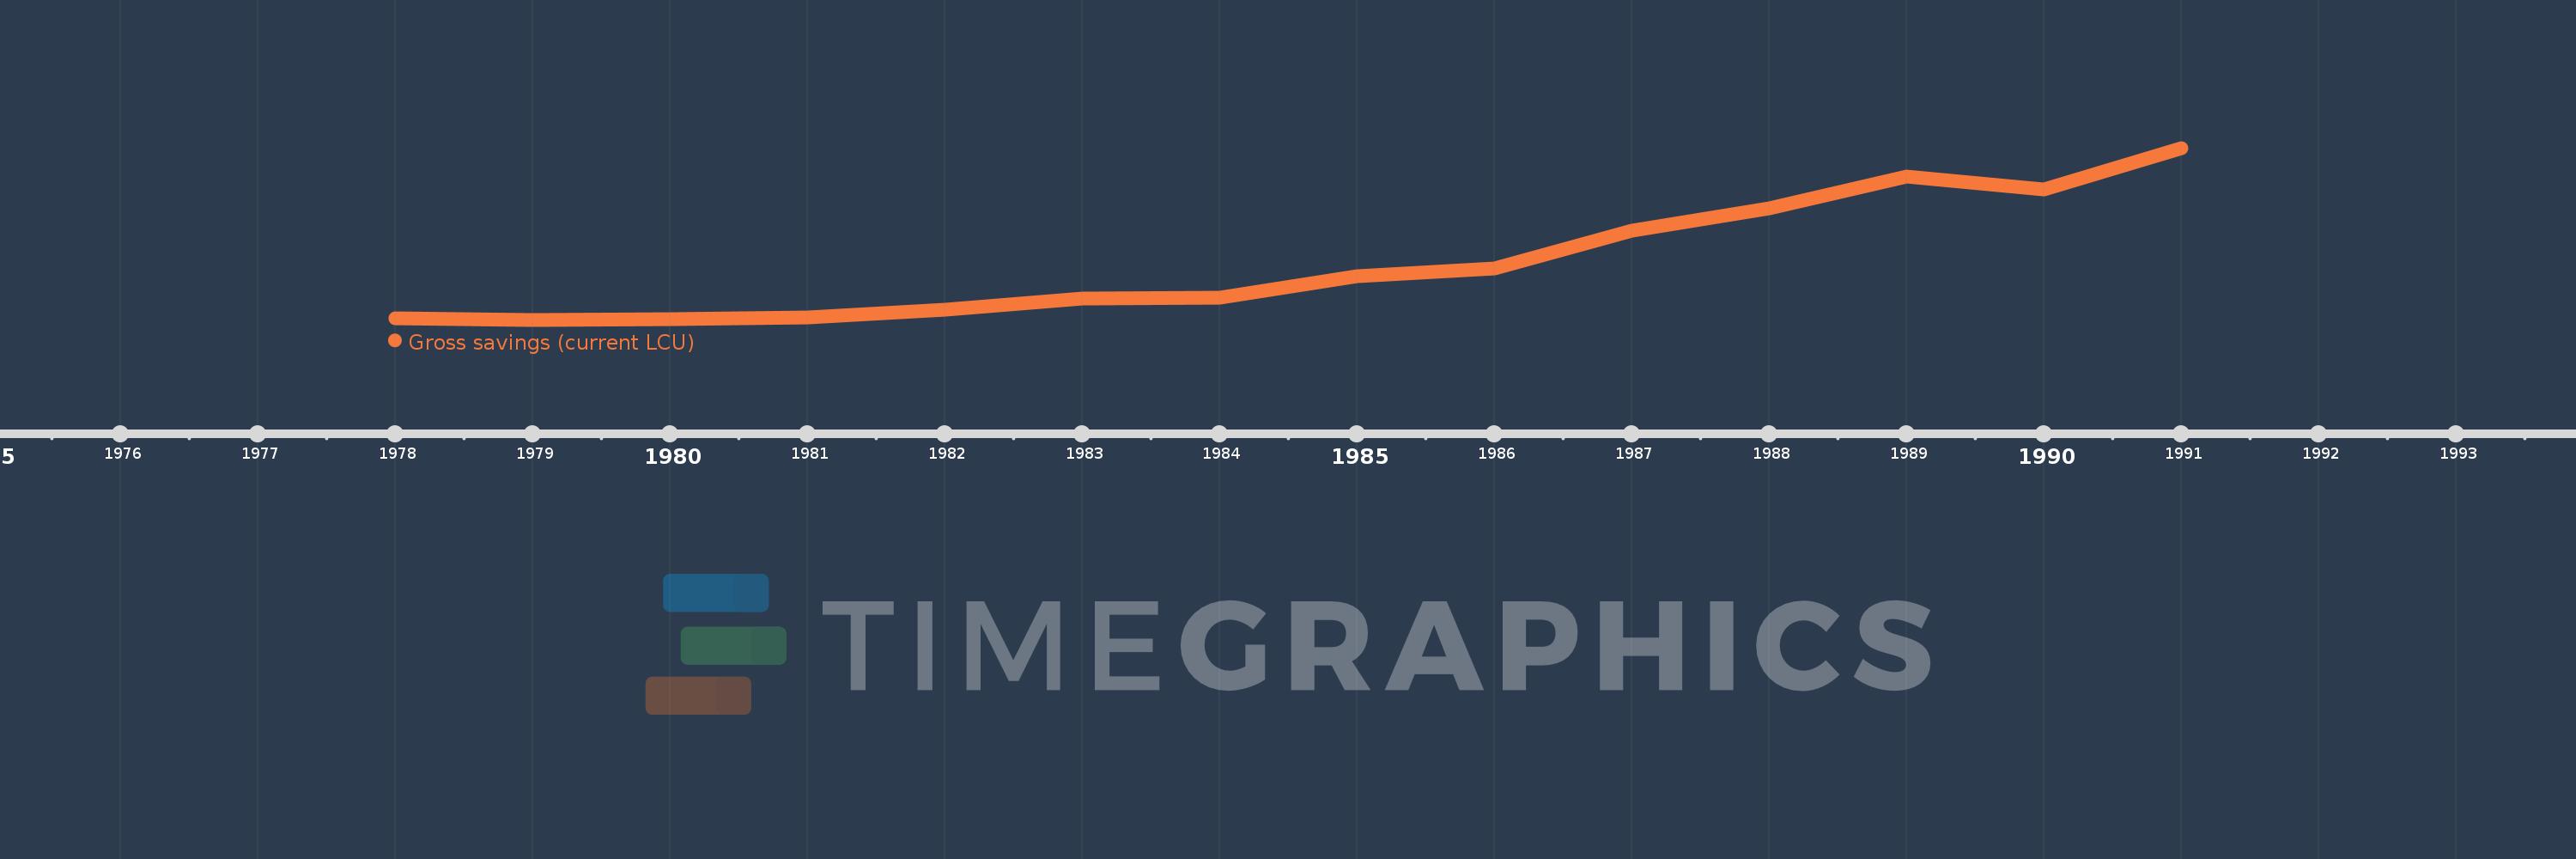
Gross savings (current LCU)
1991,1990,1989,1988,1987,1986,1985,1984,1983,1982,1981,1980,1979,1978
This statistics in other country:
AfghanistanAlbaniaAlgeriaAngolaAntigua and BarbudaArgentinaArmeniaAustraliaAustriaAzerbaijanBahamas, TheBahrainBangladeshBarbadosBelarusBelgiumBelizeBeninBermudaBhutanBoliviaBosnia and HerzegovinaBotswanaBrazilBrunei DarussalamBulgariaBurkina FasoBurundiCabo VerdeCambodiaCameroonCanadaCentral African RepublicChadChileChinaColombiaComorosCongo, Dem. Rep.Congo, Rep.Costa RicaCote d'IvoireCroatiaCyprusCzech RepublicDenmarkDjiboutiDominicaDominican RepublicEcuadorEgypt, Arab Rep.El SalvadorEquatorial GuineaEritreaEstoniaEthiopiaFaroe IslandsFijiFinlandFranceGabonGambia, TheGeorgiaGermanyGhanaGreeceGrenadaGuatemalaGuineaGuinea-BissauGuyanaHaitiHondurasHong Kong SAR, ChinaHungaryIcelandIndiaIndonesiaIran, Islamic Rep.IraqIrelandIsraelItalyJamaicaJapanJordanKazakhstanKenyaKiribatiKorea, Rep.KosovoKuwaitKyrgyz RepublicLao PDRLatviaLebanonLesothoLiberiaLibyaLithuaniaLuxembourgMacao SAR, ChinaMacedonia, FYRMadagascarMalawiMalaysiaMaldivesMaliMaltaMauritaniaMauritiusMexicoMoldovaMongoliaMontenegroMoroccoMozambiqueNamibiaNepalNetherlandsNew ZealandNicaraguaNigerNigeriaNorwayOmanPakistanPanamaPapua New GuineaParaguayPeruPhilippinesPolandPortugalQatarRomaniaRussian FederationRwandaSaudi ArabiaSenegalSerbiaSeychellesSierra LeoneSingaporeSlovak RepublicSloveniaSolomon IslandsSouth AfricaSouth SudanSpainSri LankaSt. Kitts and NevisSt. LuciaSt. Vincent and the GrenadinesSudanSurinameSwazilandSwedenSwitzerlandSyrian Arab RepublicTajikistanTanzaniaThailandTimor-LesteTogoTongaTrinidad and TobagoTunisiaTurkeyUgandaUkraineUnited KingdomUnited StatesUruguayVanuatuVenezuela, RBVietnamWest Bank and GazaYemen, Rep.ZambiaZimbabwe Timeline:
This timeline shows a graph from 1978 to 1991 of Costa Rica. No data until 1977. Number of actual observations by date: 14.
Source name:
World Development Indicators
Source organization:
World Bank national accounts data, and OECD National Accounts data files.
Categories, topics:
Economy & Growth
Last updated:
apr 23, 2017
Indicators value changes by year
Minimum:
3.885 bln
jan 1, 1979
Maximum:
78.592 bln
jan 1, 1991
At the date of observation
Value
Absolute change
Change from previous value
jan 1, 1978
4.404 bln
+4.404 bln
0.0%
jan 1, 1979
3.885 bln
-518.695 mln
-11.78%
jan 1, 1980
4.024 bln
+139.444 mln
3.59%
jan 1, 1981
4.994 bln
+969.563 mln
24.09%
jan 1, 1982
8.179 bln
+3.185 bln
63.79%
jan 1, 1983
13.151 bln
+4.971 bln
60.78%
jan 1, 1984
13.553 bln
+402.367 mln
3.06%
jan 1, 1985
22.851 bln
+9.298 bln
68.6%
jan 1, 1986
26.227 bln
+3.376 bln
14.78%
jan 1, 1987
42.534 bln
+16.307 bln
62.18%
jan 1, 1988
52.299 bln
+9.764 bln
22.96%
jan 1, 1989
65.971 bln
+13.672 bln
26.14%
jan 1, 1990
60.463 bln
-5.508 bln
-8.35%
jan 1, 1991
78.592 bln
+18.129 bln
29.98%
Ranking of countries by current statistics by years


Comments: