29
/
en
AIzaSyAYiBZKx7MnpbEhh9jyipgxe19OcubqV5w
April 1, 2024
181892
Luxembourg
LUX
true
2
1
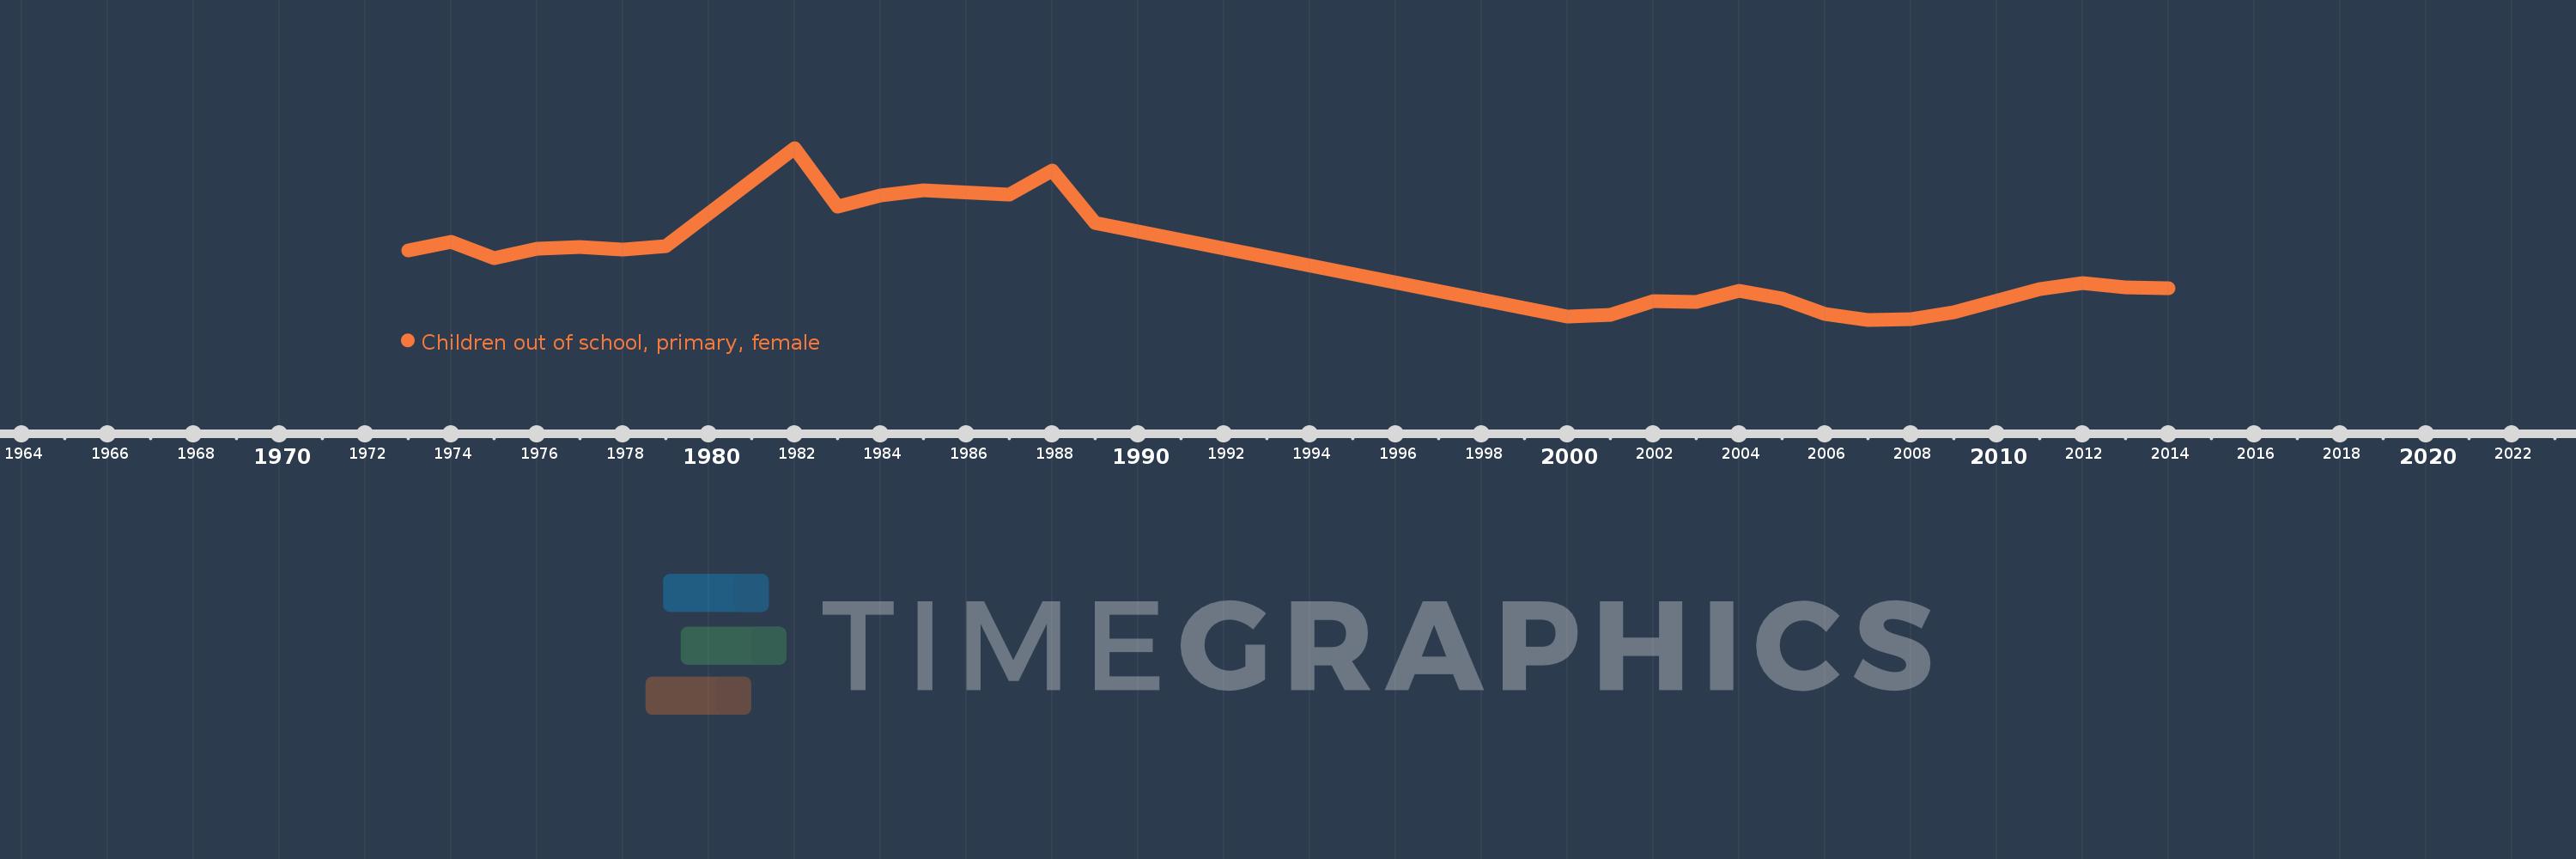
Children out of school, primary, female
2014,2013,2012,2011,2009,2008,2007,2006,2005,2004,2003,2002,2001,2000,1989,1988,1987,1985,1984,1983,1982,1979,1978,1977,1976,1975,1974,1973
This statistics in other country:
AfghanistanAlbaniaAlgeriaAngolaAntigua and BarbudaArab WorldArgentinaArmeniaArubaAustraliaAustriaAzerbaijanBahamas, TheBahrainBangladeshBarbadosBelarusBelgiumBelizeBeninBermudaBhutanBoliviaBosnia and HerzegovinaBotswanaBrazilBrunei DarussalamBulgariaBurkina FasoBurundiCabo VerdeCambodiaCameroonCanadaCaribbean small statesCentral African RepublicCentral Europe and the BalticsChadChileChinaColombiaComorosCongo, Dem. Rep.Congo, Rep.Costa RicaCote d'IvoireCroatiaCubaCyprusDenmarkDjiboutiDominicaDominican RepublicEarly-demographic dividendEast Asia & PacificEast Asia & Pacific (excluding high income)East Asia & Pacific (IDA & IBRD countries)EcuadorEgypt, Arab Rep.El SalvadorEquatorial GuineaEritreaEstoniaEthiopiaEuro areaEurope & Central AsiaEurope & Central Asia (excluding high income)Europe & Central Asia (IDA & IBRD countries)European UnionFijiFinlandFragile and conflict affected situationsFranceGabonGambia, TheGeorgiaGhanaGreeceGrenadaGuatemalaGuineaGuinea-BissauGuyanaHaitiHeavily indebted poor countries (HIPC)High incomeHondurasHong Kong SAR, ChinaHungaryIBRD onlyIcelandIDA & IBRD totalIDA blendIDA onlyIDA totalIndiaIndonesiaIran, Islamic Rep.IraqIrelandIsraelItalyJamaicaJapanJordanKazakhstanKenyaKiribatiKorea, Dem. People’s Rep.Korea, Rep.KuwaitKyrgyz RepublicLao PDRLate-demographic dividendLatin America & Caribbean Latin America & Caribbean (excluding high income)Latin America & the Caribbean (IDA & IBRD countries)LatviaLeast developed countries: UN classificationLebanonLesothoLiberiaLibyaLiechtensteinLithuaniaLow & middle incomeLow incomeLower middle incomeLuxembourgMacao SAR, ChinaMacedonia, FYRMadagascarMalawiMaldivesMaliMaltaMarshall IslandsMauritaniaMauritiusMexicoMicronesia, Fed. Sts.Middle East & North AfricaMiddle East & North Africa (excluding high income)Middle East & North Africa (IDA & IBRD countries)Middle incomeMoldovaMongoliaMontenegroMoroccoMozambiqueMyanmarNamibiaNauruNepalNetherlandsNew ZealandNicaraguaNigerNigeriaNorth AmericaNorwayOECD membersOmanOther small statesPacific island small statesPakistanPanamaPapua New GuineaParaguayPeruPhilippinesPolandPortugalPost-demographic dividendPre-demographic dividendPuerto RicoQatarRomaniaRussian FederationRwandaSamoaSan MarinoSao Tome and PrincipeSaudi ArabiaSenegalSerbiaSeychellesSierra LeoneSloveniaSmall statesSolomon IslandsSomaliaSouth AfricaSouth AsiaSouth Asia (IDA & IBRD)South SudanSpainSri LankaSt. Kitts and NevisSt. LuciaSt. Vincent and the GrenadinesSub-Saharan Africa Sub-Saharan Africa (excluding high income)Sub-Saharan Africa (IDA & IBRD countries)SudanSurinameSwazilandSwedenSwitzerlandSyrian Arab RepublicTajikistanTanzaniaThailandTimor-LesteTogoTongaTrinidad and TobagoTunisiaTurkeyTuvaluUgandaUkraineUnited Arab EmiratesUnited KingdomUnited StatesUpper middle incomeUruguayUzbekistanVanuatuVenezuela, RBWest Bank and GazaWorldYemen, Rep.ZambiaZimbabwe Timeline:
This timeline shows a graph from 1973 to 2014 of Luxembourg. No data until 1972. Number of actual observations by date: 28.
Source name:
World Development Indicators
Source organization:
United Nations Educational, Scientific, and Cultural Organization (UNESCO) Institute for Statistics.
Categories, topics:
Education, Gender
Last updated:
apr 23, 2017
Indicators value changes by year
Maximum:
2.824K
jan 1, 1982
At the date of observation
Value
Absolute change
Change from previous value
jan 1, 1973
1.259K
+1.259K
0.0%
jan 1, 1974
1.394K
+135.0
10.72%
jan 1, 1975
1.145K
-249.0
-17.86%
jan 1, 1976
1.28K
+135.0
11.79%
jan 1, 1977
1.316K
+36.0
2.81%
jan 1, 1978
1.276K
-40.0
-3.04%
jan 1, 1979
1.33K
+54.0
4.23%
jan 1, 1982
2.824K
+1.494K
112.33%
jan 1, 1983
1.932K
-892.0
-31.59%
jan 1, 1984
2.095K
+163.0
8.44%
jan 1, 1985
2.171K
+76.0
3.63%
jan 1, 1987
2.109K
-62.0
-2.86%
jan 1, 1988
2.479K
+370.0
17.54%
jan 1, 1989
1.682K
-797.0
-32.15%
jan 1, 2000
248.0
-1.434K
-85.26%
jan 1, 2001
281.0
+33.0
13.31%
jan 1, 2002
482.0
+201.0
71.53%
jan 1, 2003
471.0
-11.0
-2.28%
jan 1, 2004
645.0
+174.0
36.94%
jan 1, 2005
531.0
-114.0
-17.67%
jan 1, 2006
293.0
-238.0
-44.82%
jan 1, 2007
201.0
-92.0
-31.4%
jan 1, 2008
205.0
+4.0
1.99%
jan 1, 2009
310.0
+105.0
51.22%
jan 1, 2011
669.0
+359.0
115.81%
jan 1, 2012
762.0
+93.0
13.9%
jan 1, 2013
696.0
-66.0
-8.66%
jan 1, 2014
686.0
-10.0
-1.44%
Ranking of countries by current statistics by years


Comments: