29
/
en
AIzaSyAYiBZKx7MnpbEhh9jyipgxe19OcubqV5w
April 1, 2024
59583
Sub-Saharan Africa (excluding high income)
SSA
false
2
1
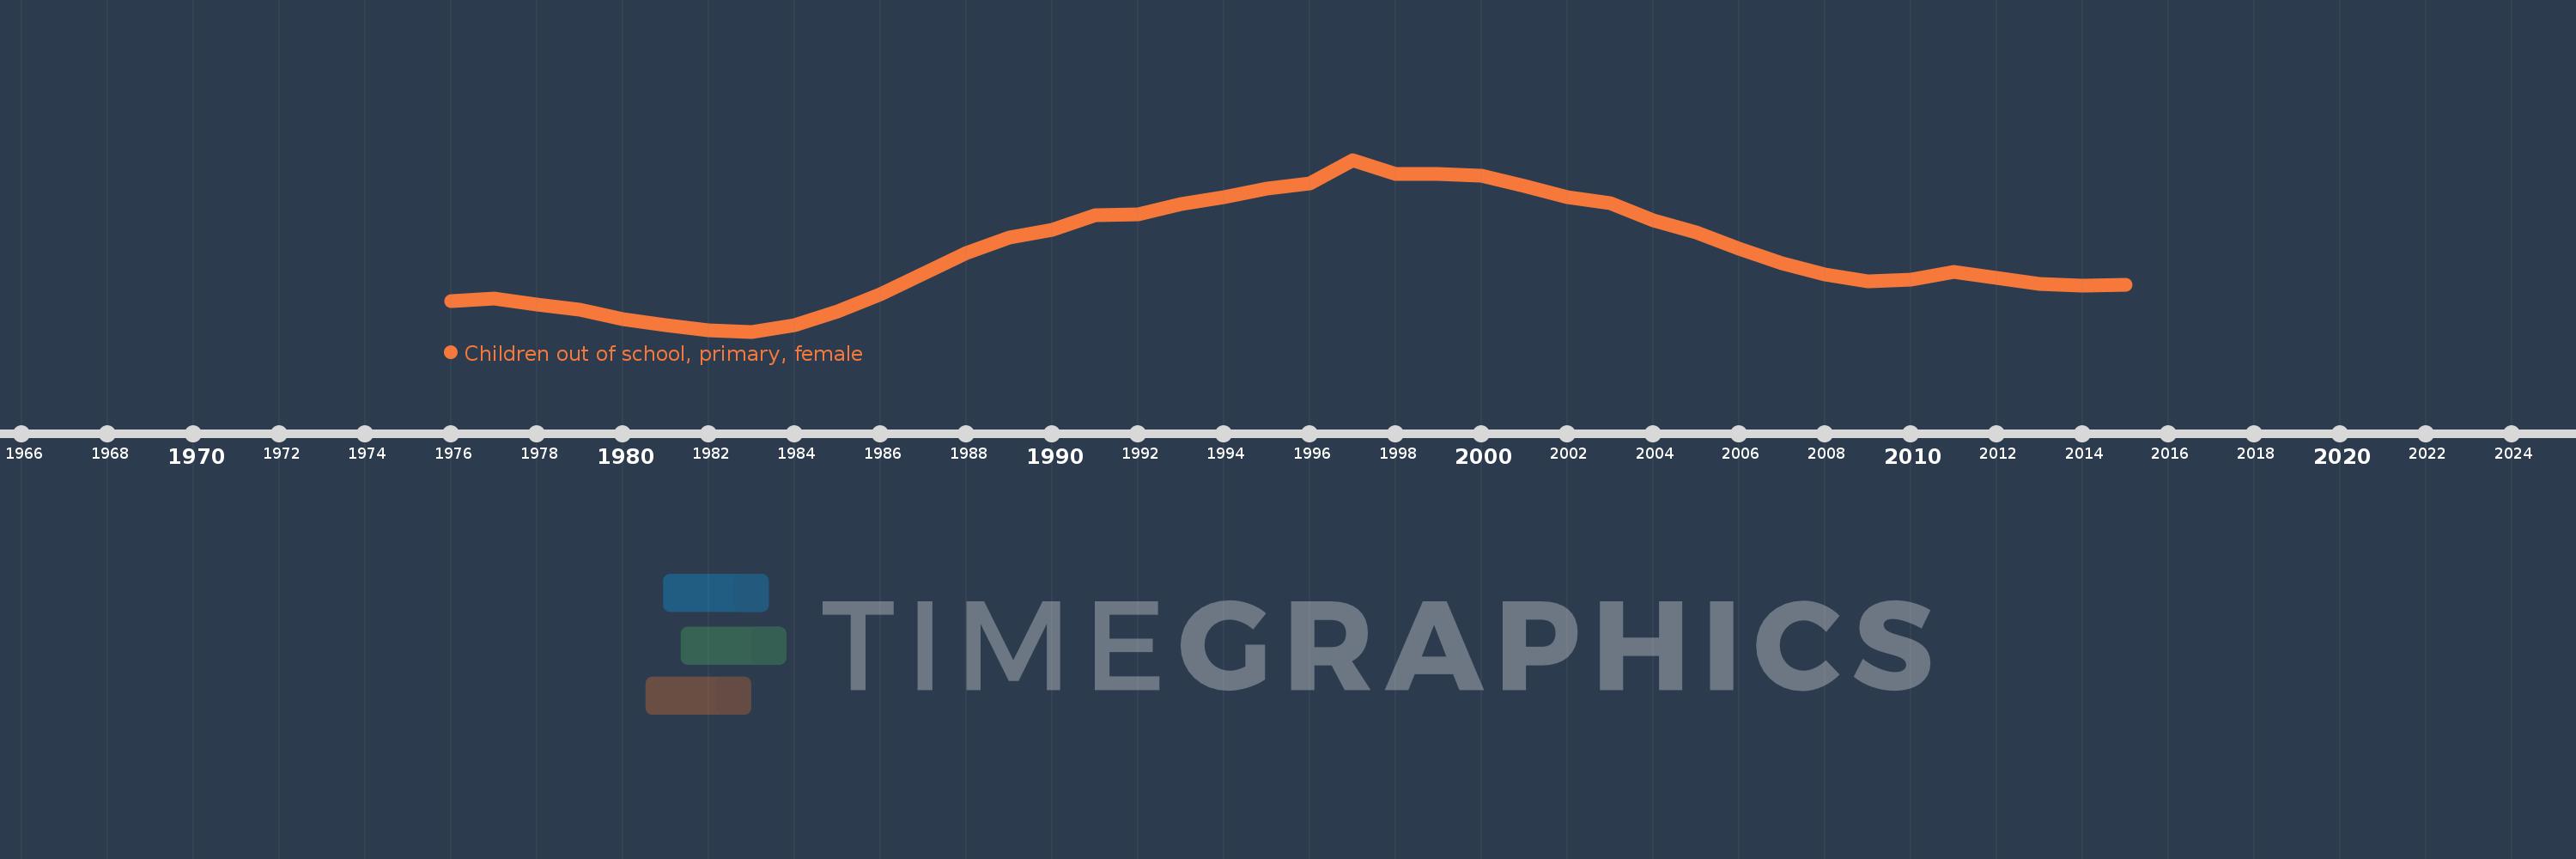
Children out of school, primary, female
2015,2014,2013,2012,2011,2010,2009,2008,2007,2006,2005,2004,2003,2002,2001,2000,1999,1998,1997,1996,1995,1994,1993,1992,1991,1990,1989,1988,1987,1986,1985,1984,1983,1982,1981,1980,1979,1978,1977,1976
This statistics in other country:
AfghanistanAlbaniaAlgeriaAngolaAntigua and BarbudaArab WorldArgentinaArmeniaArubaAustraliaAustriaAzerbaijanBahamas, TheBahrainBangladeshBarbadosBelarusBelgiumBelizeBeninBermudaBhutanBoliviaBosnia and HerzegovinaBotswanaBrazilBrunei DarussalamBulgariaBurkina FasoBurundiCabo VerdeCambodiaCameroonCanadaCaribbean small statesCentral African RepublicCentral Europe and the BalticsChadChileChinaColombiaComorosCongo, Dem. Rep.Congo, Rep.Costa RicaCote d'IvoireCroatiaCubaCyprusDenmarkDjiboutiDominicaDominican RepublicEarly-demographic dividendEast Asia & PacificEast Asia & Pacific (excluding high income)East Asia & Pacific (IDA & IBRD countries)EcuadorEgypt, Arab Rep.El SalvadorEquatorial GuineaEritreaEstoniaEthiopiaEuro areaEurope & Central AsiaEurope & Central Asia (excluding high income)Europe & Central Asia (IDA & IBRD countries)European UnionFijiFinlandFragile and conflict affected situationsFranceGabonGambia, TheGeorgiaGhanaGreeceGrenadaGuatemalaGuineaGuinea-BissauGuyanaHaitiHeavily indebted poor countries (HIPC)High incomeHondurasHong Kong SAR, ChinaHungaryIBRD onlyIcelandIDA & IBRD totalIDA blendIDA onlyIDA totalIndiaIndonesiaIran, Islamic Rep.IraqIrelandIsraelItalyJamaicaJapanJordanKazakhstanKenyaKiribatiKorea, Dem. People’s Rep.Korea, Rep.KuwaitKyrgyz RepublicLao PDRLate-demographic dividendLatin America & Caribbean Latin America & Caribbean (excluding high income)Latin America & the Caribbean (IDA & IBRD countries)LatviaLeast developed countries: UN classificationLebanonLesothoLiberiaLibyaLiechtensteinLithuaniaLow & middle incomeLow incomeLower middle incomeLuxembourgMacao SAR, ChinaMacedonia, FYRMadagascarMalawiMaldivesMaliMaltaMarshall IslandsMauritaniaMauritiusMexicoMicronesia, Fed. Sts.Middle East & North AfricaMiddle East & North Africa (excluding high income)Middle East & North Africa (IDA & IBRD countries)Middle incomeMoldovaMongoliaMontenegroMoroccoMozambiqueMyanmarNamibiaNauruNepalNetherlandsNew ZealandNicaraguaNigerNigeriaNorth AmericaNorwayOECD membersOmanOther small statesPacific island small statesPakistanPanamaPapua New GuineaParaguayPeruPhilippinesPolandPortugalPost-demographic dividendPre-demographic dividendPuerto RicoQatarRomaniaRussian FederationRwandaSamoaSan MarinoSao Tome and PrincipeSaudi ArabiaSenegalSerbiaSeychellesSierra LeoneSloveniaSmall statesSolomon IslandsSomaliaSouth AfricaSouth AsiaSouth Asia (IDA & IBRD)South SudanSpainSri LankaSt. Kitts and NevisSt. LuciaSt. Vincent and the GrenadinesSub-Saharan Africa Sub-Saharan Africa (excluding high income)Sub-Saharan Africa (IDA & IBRD countries)SudanSurinameSwazilandSwedenSwitzerlandSyrian Arab RepublicTajikistanTanzaniaThailandTimor-LesteTogoTongaTrinidad and TobagoTunisiaTurkeyTuvaluUgandaUkraineUnited Arab EmiratesUnited KingdomUnited StatesUpper middle incomeUruguayUzbekistanVanuatuVenezuela, RBWest Bank and GazaWorldYemen, Rep.ZambiaZimbabwe Timeline:
This timeline shows a graph from 1976 to 2015 of Sub-Saharan Africa (excluding high income). No data until 1975. Number of actual observations by date: 40.
Source name:
World Development Indicators
Source organization:
United Nations Educational, Scientific, and Cultural Organization (UNESCO) Institute for Statistics.
Categories, topics:
Education, Gender
Last updated:
apr 23, 2017
Indicators value changes by year
Minimum:
15.962 mln
jan 1, 1983
Maximum:
25.363 mln
jan 1, 1997
At the date of observation
Value
Absolute change
Change from previous value
jan 1, 1976
17.628 mln
+17.628 mln
0.0%
jan 1, 1977
17.755 mln
+126.676K
0.72%
jan 1, 1978
17.447 mln
-307.32K
-1.73%
jan 1, 1979
17.142 mln
-305.06K
-1.75%
jan 1, 1980
16.636 mln
-506.487K
-2.95%
jan 1, 1981
16.323 mln
-313.028K
-1.88%
jan 1, 1982
16.04 mln
-282.806K
-1.73%
jan 1, 1983
15.962 mln
-78.102K
-0.49%
jan 1, 1984
16.321 mln
+359.071K
2.25%
jan 1, 1985
17.046 mln
+724.514K
4.44%
jan 1, 1986
18.003 mln
+957.042K
5.61%
jan 1, 1987
19.127 mln
+1.124 mln
6.24%
jan 1, 1988
20.244 mln
+1.118 mln
5.84%
jan 1, 1989
21.108 mln
+863.958K
4.27%
jan 1, 1990
21.528 mln
+419.79K
1.99%
jan 1, 1991
22.309 mln
+781.4K
3.63%
jan 1, 1992
22.356 mln
+46.454K
0.21%
jan 1, 1993
22.963 mln
+607.462K
2.72%
jan 1, 1994
23.326 mln
+362.454K
1.58%
jan 1, 1995
23.769 mln
+443.722K
1.9%
jan 1, 1996
24.092 mln
+322.592K
1.36%
jan 1, 1997
25.363 mln
+1.271 mln
5.28%
jan 1, 1998
24.572 mln
-791.388K
-3.12%
jan 1, 1999
24.607 mln
+35.372K
0.14%
jan 1, 2000
24.508 mln
-99.14K
-0.4%
jan 1, 2001
23.909 mln
-598.508K
-2.44%
jan 1, 2002
23.333 mln
-575.928K
-2.41%
jan 1, 2003
22.969 mln
-364.332K
-1.56%
jan 1, 2004
22.069 mln
-900.084K
-3.92%
jan 1, 2005
21.398 mln
-670.6K
-3.04%
jan 1, 2006
20.49 mln
-908.554K
-4.25%
jan 1, 2007
19.707 mln
-782.914K
-3.82%
jan 1, 2008
19.094 mln
-613.25K
-3.11%
jan 1, 2009
18.697 mln
-397.018K
-2.08%
jan 1, 2010
18.807 mln
+110.852K
0.59%
jan 1, 2011
19.238 mln
+430.92K
2.29%
jan 1, 2012
18.88 mln
-358.164K
-1.86%
jan 1, 2013
18.58 mln
-300.13K
-1.59%
jan 1, 2014
18.483 mln
-96.794K
-0.52%
jan 1, 2015
18.537 mln
+53.744K
0.29%
Ranking of countries by current statistics by years


Comments: