29
/
en
AIzaSyAYiBZKx7MnpbEhh9jyipgxe19OcubqV5w
April 1, 2024
65750
Algeria
DZA
true
2
1
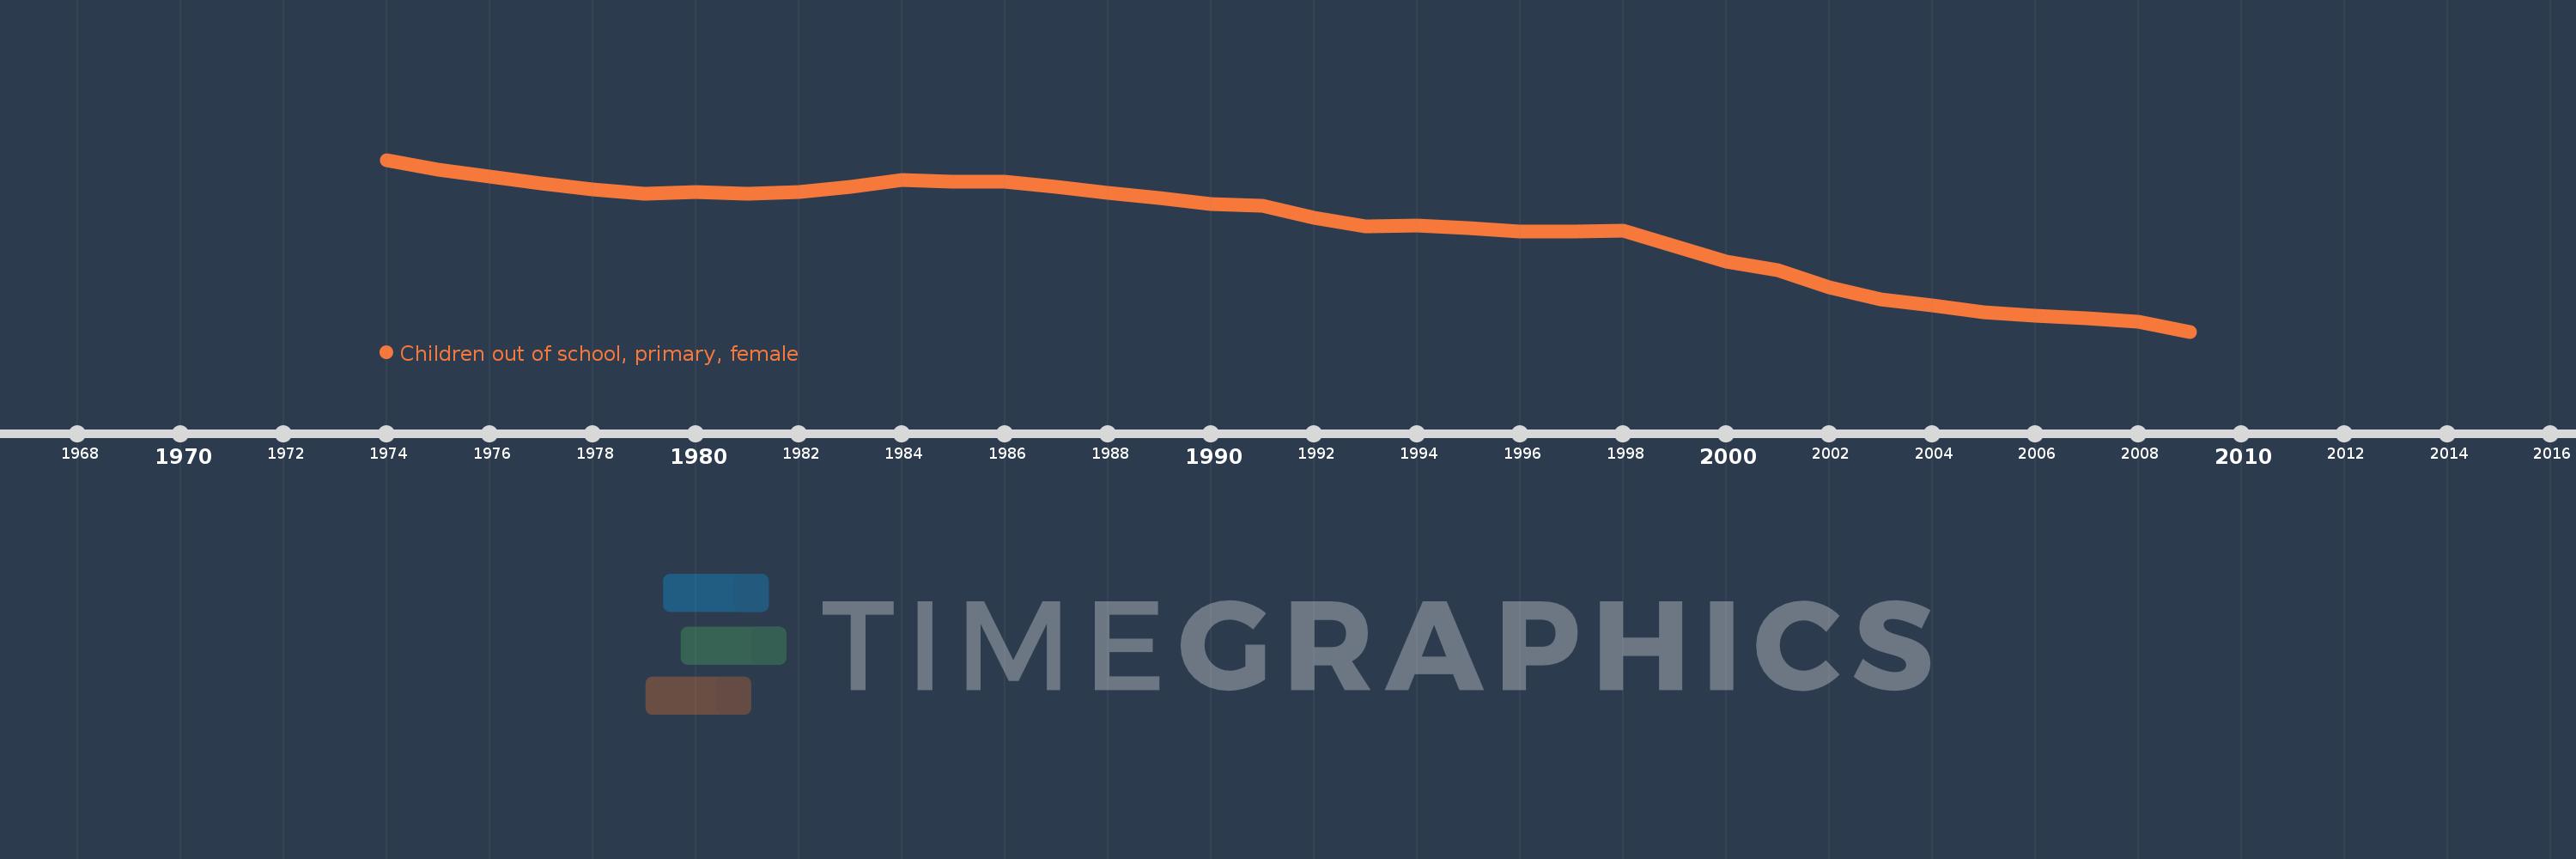
Children out of school, primary, female
2009,2008,2007,2006,2005,2004,2003,2002,2001,2000,1998,1997,1996,1995,1994,1993,1992,1991,1990,1989,1988,1987,1986,1985,1984,1983,1982,1981,1980,1979,1978,1977,1976,1975,1974
This statistics in other country:
AfghanistanAlbaniaAlgeriaAngolaAntigua and BarbudaArab WorldArgentinaArmeniaArubaAustraliaAustriaAzerbaijanBahamas, TheBahrainBangladeshBarbadosBelarusBelgiumBelizeBeninBermudaBhutanBoliviaBosnia and HerzegovinaBotswanaBrazilBrunei DarussalamBulgariaBurkina FasoBurundiCabo VerdeCambodiaCameroonCanadaCaribbean small statesCentral African RepublicCentral Europe and the BalticsChadChileChinaColombiaComorosCongo, Dem. Rep.Congo, Rep.Costa RicaCote d'IvoireCroatiaCubaCyprusDenmarkDjiboutiDominicaDominican RepublicEarly-demographic dividendEast Asia & PacificEast Asia & Pacific (excluding high income)East Asia & Pacific (IDA & IBRD countries)EcuadorEgypt, Arab Rep.El SalvadorEquatorial GuineaEritreaEstoniaEthiopiaEuro areaEurope & Central AsiaEurope & Central Asia (excluding high income)Europe & Central Asia (IDA & IBRD countries)European UnionFijiFinlandFragile and conflict affected situationsFranceGabonGambia, TheGeorgiaGhanaGreeceGrenadaGuatemalaGuineaGuinea-BissauGuyanaHaitiHeavily indebted poor countries (HIPC)High incomeHondurasHong Kong SAR, ChinaHungaryIBRD onlyIcelandIDA & IBRD totalIDA blendIDA onlyIDA totalIndiaIndonesiaIran, Islamic Rep.IraqIrelandIsraelItalyJamaicaJapanJordanKazakhstanKenyaKiribatiKorea, Dem. People’s Rep.Korea, Rep.KuwaitKyrgyz RepublicLao PDRLate-demographic dividendLatin America & Caribbean Latin America & Caribbean (excluding high income)Latin America & the Caribbean (IDA & IBRD countries)LatviaLeast developed countries: UN classificationLebanonLesothoLiberiaLibyaLiechtensteinLithuaniaLow & middle incomeLow incomeLower middle incomeLuxembourgMacao SAR, ChinaMacedonia, FYRMadagascarMalawiMaldivesMaliMaltaMarshall IslandsMauritaniaMauritiusMexicoMicronesia, Fed. Sts.Middle East & North AfricaMiddle East & North Africa (excluding high income)Middle East & North Africa (IDA & IBRD countries)Middle incomeMoldovaMongoliaMontenegroMoroccoMozambiqueMyanmarNamibiaNauruNepalNetherlandsNew ZealandNicaraguaNigerNigeriaNorth AmericaNorwayOECD membersOmanOther small statesPacific island small statesPakistanPanamaPapua New GuineaParaguayPeruPhilippinesPolandPortugalPost-demographic dividendPre-demographic dividendPuerto RicoQatarRomaniaRussian FederationRwandaSamoaSan MarinoSao Tome and PrincipeSaudi ArabiaSenegalSerbiaSeychellesSierra LeoneSloveniaSmall statesSolomon IslandsSomaliaSouth AfricaSouth AsiaSouth Asia (IDA & IBRD)South SudanSpainSri LankaSt. Kitts and NevisSt. LuciaSt. Vincent and the GrenadinesSub-Saharan Africa Sub-Saharan Africa (excluding high income)Sub-Saharan Africa (IDA & IBRD countries)SudanSurinameSwazilandSwedenSwitzerlandSyrian Arab RepublicTajikistanTanzaniaThailandTimor-LesteTogoTongaTrinidad and TobagoTunisiaTurkeyTuvaluUgandaUkraineUnited Arab EmiratesUnited KingdomUnited StatesUpper middle incomeUruguayUzbekistanVanuatuVenezuela, RBWest Bank and GazaWorldYemen, Rep.ZambiaZimbabwe Timeline:
This timeline shows a graph from 1974 to 2009 of Algeria. No data until 1973. Number of actual observations by date: 35.
Source name:
World Development Indicators
Source organization:
United Nations Educational, Scientific, and Cultural Organization (UNESCO) Institute for Statistics.
Categories, topics:
Education, Gender
Last updated:
apr 23, 2017
Indicators value changes by year
Minimum:
63.036K
jan 1, 2009
Maximum:
589.807K
jan 1, 1974
At the date of observation
Value
Absolute change
Change from previous value
jan 1, 1974
589.807K
+589.807K
0.0%
jan 1, 1975
559.643K
-30.164K
-5.11%
jan 1, 1976
538.301K
-21.342K
-3.81%
jan 1, 1977
517.774K
-20.527K
-3.81%
jan 1, 1978
498.428K
-19.346K
-3.74%
jan 1, 1979
487.011K
-11.417K
-2.29%
jan 1, 1980
490.898K
+3.887K
0.8%
jan 1, 1981
485.119K
-5.779K
-1.18%
jan 1, 1982
491.048K
+5.929K
1.22%
jan 1, 1983
507.138K
+16.09K
3.28%
jan 1, 1984
526.871K
+19.733K
3.89%
jan 1, 1985
522.045K
-4.826K
-0.92%
jan 1, 1986
523.184K
+1.139K
0.22%
jan 1, 1987
506.303K
-16.881K
-3.23%
jan 1, 1988
487.538K
-18.765K
-3.71%
jan 1, 1989
472.496K
-15.042K
-3.09%
jan 1, 1990
455.074K
-17.422K
-3.69%
jan 1, 1991
448.068K
-7.006K
-1.54%
jan 1, 1992
411.661K
-36.407K
-8.13%
jan 1, 1993
384.899K
-26.762K
-6.5%
jan 1, 1994
388.898K
+3.999K
1.04%
jan 1, 1995
381.226K
-7.672K
-1.97%
jan 1, 1996
370.065K
-11.161K
-2.93%
jan 1, 1997
369.571K
-494.0
-0.13%
jan 1, 1998
372.087K
+2.516K
0.68%
jan 1, 2000
278.997K
-93.09K
-25.02%
jan 1, 2001
250.964K
-28.033K
-10.05%
jan 1, 2002
198.374K
-52.59K
-20.96%
jan 1, 2003
161.366K
-37.008K
-18.66%
jan 1, 2004
142.68K
-18.686K
-11.58%
jan 1, 2005
121.26K
-21.42K
-15.01%
jan 1, 2006
110.495K
-10.765K
-8.88%
jan 1, 2007
102.663K
-7.832K
-7.09%
jan 1, 2008
92.175K
-10.488K
-10.22%
jan 1, 2009
63.036K
-29.139K
-31.61%
Ranking of countries by current statistics by years


Comments: