29
/
en
AIzaSyAYiBZKx7MnpbEhh9jyipgxe19OcubqV5w
April 1, 2024
24721
Caribbean small states
CSS
false
2
1
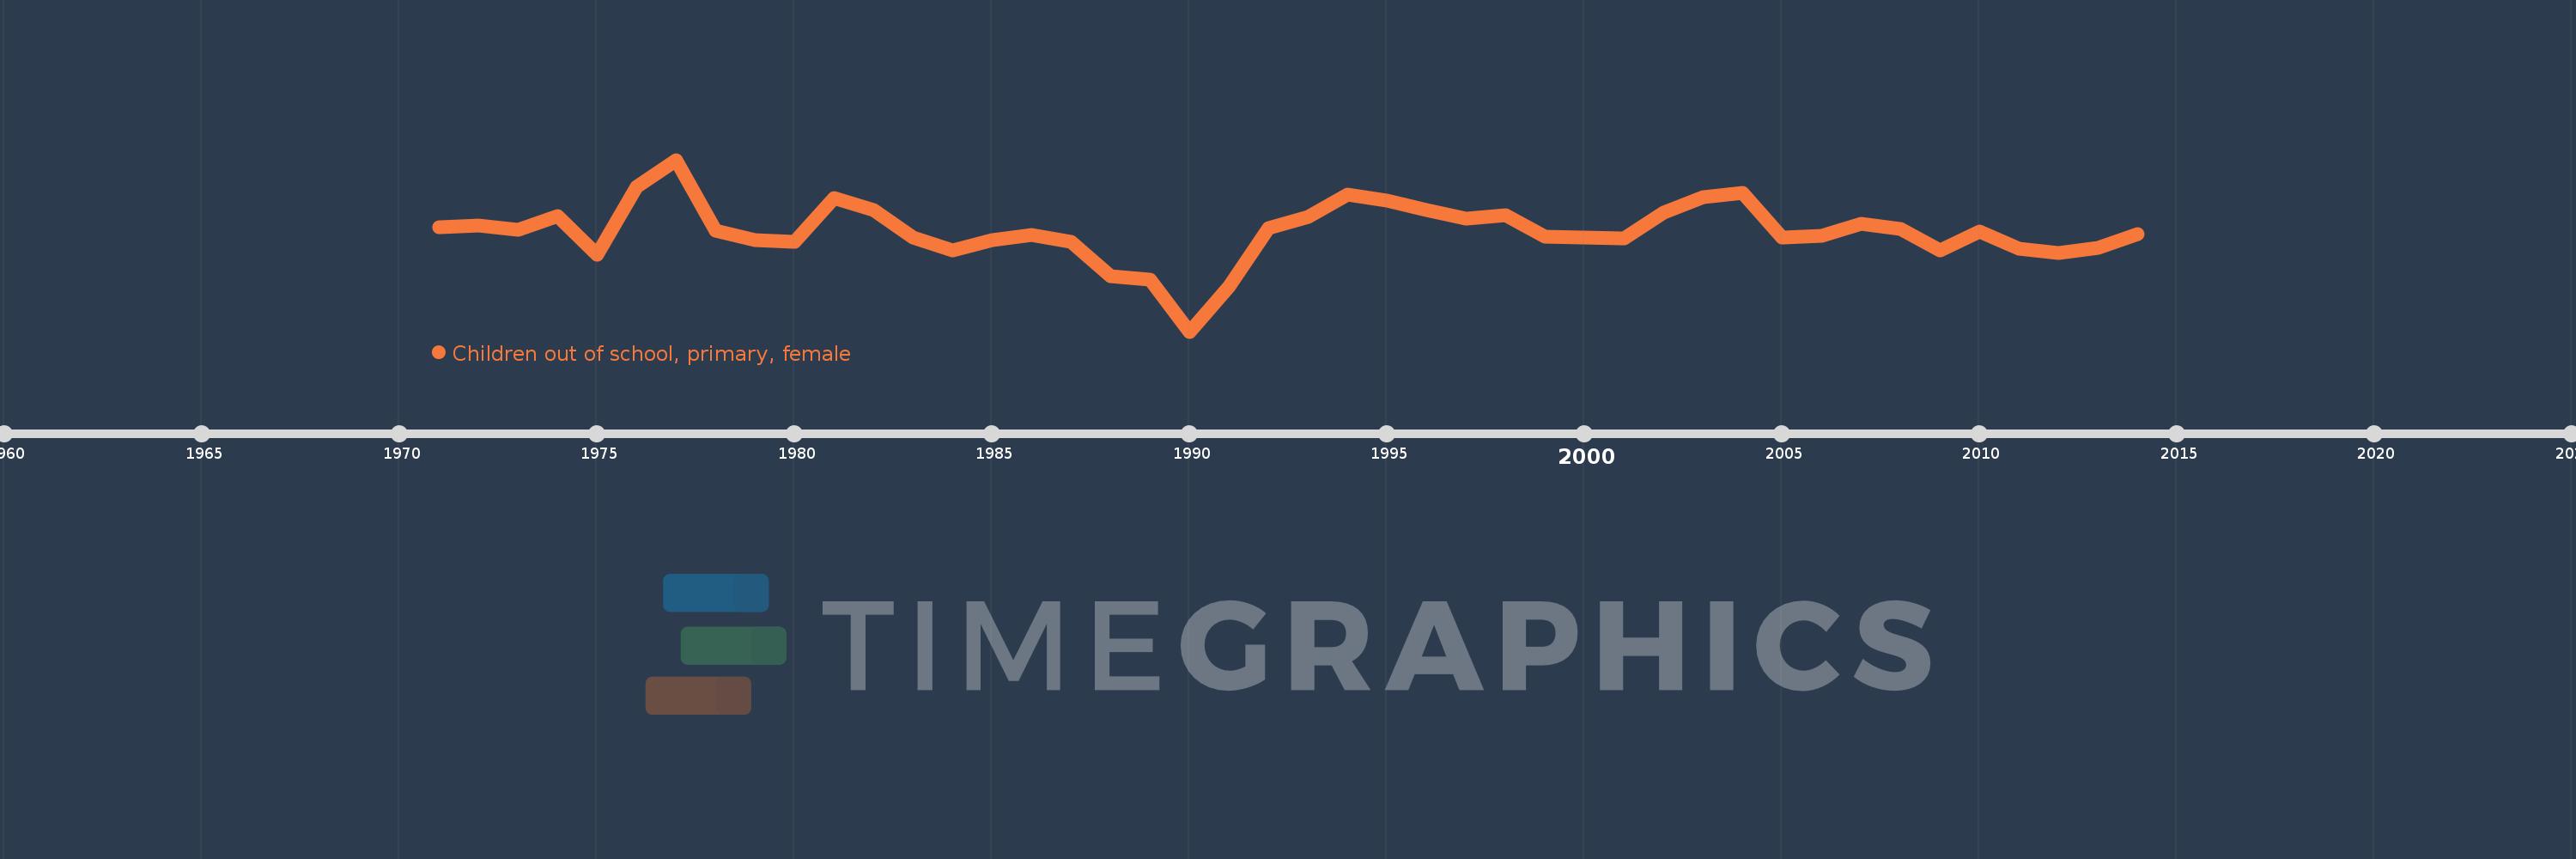
Children out of school, primary, female
2014,2013,2012,2011,2010,2009,2008,2007,2006,2005,2004,2003,2002,2001,2000,1999,1998,1997,1996,1995,1994,1993,1992,1991,1990,1989,1988,1987,1986,1985,1984,1983,1982,1981,1980,1979,1978,1977,1976,1975,1974,1973,1972,1971
This statistics in other country:
AfghanistanAlbaniaAlgeriaAngolaAntigua and BarbudaArab WorldArgentinaArmeniaArubaAustraliaAustriaAzerbaijanBahamas, TheBahrainBangladeshBarbadosBelarusBelgiumBelizeBeninBermudaBhutanBoliviaBosnia and HerzegovinaBotswanaBrazilBrunei DarussalamBulgariaBurkina FasoBurundiCabo VerdeCambodiaCameroonCanadaCaribbean small statesCentral African RepublicCentral Europe and the BalticsChadChileChinaColombiaComorosCongo, Dem. Rep.Congo, Rep.Costa RicaCote d'IvoireCroatiaCubaCyprusDenmarkDjiboutiDominicaDominican RepublicEarly-demographic dividendEast Asia & PacificEast Asia & Pacific (excluding high income)East Asia & Pacific (IDA & IBRD countries)EcuadorEgypt, Arab Rep.El SalvadorEquatorial GuineaEritreaEstoniaEthiopiaEuro areaEurope & Central AsiaEurope & Central Asia (excluding high income)Europe & Central Asia (IDA & IBRD countries)European UnionFijiFinlandFragile and conflict affected situationsFranceGabonGambia, TheGeorgiaGhanaGreeceGrenadaGuatemalaGuineaGuinea-BissauGuyanaHaitiHeavily indebted poor countries (HIPC)High incomeHondurasHong Kong SAR, ChinaHungaryIBRD onlyIcelandIDA & IBRD totalIDA blendIDA onlyIDA totalIndiaIndonesiaIran, Islamic Rep.IraqIrelandIsraelItalyJamaicaJapanJordanKazakhstanKenyaKiribatiKorea, Dem. People’s Rep.Korea, Rep.KuwaitKyrgyz RepublicLao PDRLate-demographic dividendLatin America & Caribbean Latin America & Caribbean (excluding high income)Latin America & the Caribbean (IDA & IBRD countries)LatviaLeast developed countries: UN classificationLebanonLesothoLiberiaLibyaLiechtensteinLithuaniaLow & middle incomeLow incomeLower middle incomeLuxembourgMacao SAR, ChinaMacedonia, FYRMadagascarMalawiMaldivesMaliMaltaMarshall IslandsMauritaniaMauritiusMexicoMicronesia, Fed. Sts.Middle East & North AfricaMiddle East & North Africa (excluding high income)Middle East & North Africa (IDA & IBRD countries)Middle incomeMoldovaMongoliaMontenegroMoroccoMozambiqueMyanmarNamibiaNauruNepalNetherlandsNew ZealandNicaraguaNigerNigeriaNorth AmericaNorwayOECD membersOmanOther small statesPacific island small statesPakistanPanamaPapua New GuineaParaguayPeruPhilippinesPolandPortugalPost-demographic dividendPre-demographic dividendPuerto RicoQatarRomaniaRussian FederationRwandaSamoaSan MarinoSao Tome and PrincipeSaudi ArabiaSenegalSerbiaSeychellesSierra LeoneSloveniaSmall statesSolomon IslandsSomaliaSouth AfricaSouth AsiaSouth Asia (IDA & IBRD)South SudanSpainSri LankaSt. Kitts and NevisSt. LuciaSt. Vincent and the GrenadinesSub-Saharan Africa Sub-Saharan Africa (excluding high income)Sub-Saharan Africa (IDA & IBRD countries)SudanSurinameSwazilandSwedenSwitzerlandSyrian Arab RepublicTajikistanTanzaniaThailandTimor-LesteTogoTongaTrinidad and TobagoTunisiaTurkeyTuvaluUgandaUkraineUnited Arab EmiratesUnited KingdomUnited StatesUpper middle incomeUruguayUzbekistanVanuatuVenezuela, RBWest Bank and GazaWorldYemen, Rep.ZambiaZimbabwe Timeline:
This timeline shows a graph from 1971 to 2014 of Caribbean small states. No data until 1970. Number of actual observations by date: 44.
Source name:
World Development Indicators
Source organization:
United Nations Educational, Scientific, and Cultural Organization (UNESCO) Institute for Statistics.
Categories, topics:
Education, Gender
Last updated:
apr 23, 2017
Indicators value changes by year
Minimum:
11.999K
jan 1, 1990
At the date of observation
Value
Absolute change
Change from previous value
jan 1, 1971
27.767K
+27.767K
0.0%
jan 1, 1972
28.099K
+332.0
1.2%
jan 1, 1973
27.35K
-749.0
-2.67%
jan 1, 1974
29.483K
+2.133K
7.8%
jan 1, 1975
23.618K
-5.865K
-19.89%
jan 1, 1976
33.88K
+10.262K
43.45%
jan 1, 1977
38.0K
+4.12K
12.16%
jan 1, 1978
27.259K
-10.741K
-28.27%
jan 1, 1979
25.905K
-1.354K
-4.97%
jan 1, 1980
25.585K
-320.0
-1.24%
jan 1, 1981
32.175K
+6.59K
25.76%
jan 1, 1982
30.407K
-1.768K
-5.49%
jan 1, 1983
26.263K
-4.144K
-13.63%
jan 1, 1984
24.325K
-1.938K
-7.38%
jan 1, 1985
25.875K
+1.55K
6.37%
jan 1, 1986
26.596K
+721.0
2.79%
jan 1, 1987
25.647K
-949.0
-3.57%
jan 1, 1988
20.37K
-5.277K
-20.58%
jan 1, 1989
19.814K
-556.0
-2.73%
jan 1, 1990
11.999K
-7.815K
-39.44%
jan 1, 1991
18.807K
+6.808K
56.74%
jan 1, 1992
27.703K
+8.896K
47.3%
jan 1, 1993
29.311K
+1.608K
5.8%
jan 1, 1994
32.708K
+3.397K
11.59%
jan 1, 1995
31.856K
-852.0
-2.6%
jan 1, 1996
30.386K
-1.47K
-4.61%
jan 1, 1997
29.052K
-1.334K
-4.39%
jan 1, 1998
29.674K
+622.0
2.14%
jan 1, 1999
26.4K
-3.274K
-11.03%
jan 1, 2000
26.218K
-182.0
-0.69%
jan 1, 2001
26.143K
-75.0
-0.29%
jan 1, 2002
29.954K
+3.811K
14.58%
jan 1, 2003
32.315K
+2.361K
7.88%
jan 1, 2004
33.033K
+718.0
2.22%
jan 1, 2005
26.296K
-6.737K
-20.39%
jan 1, 2006
26.495K
+199.0
0.76%
jan 1, 2007
28.304K
+1.809K
6.83%
jan 1, 2008
27.589K
-715.0
-2.53%
jan 1, 2009
24.265K
-3.324K
-12.05%
jan 1, 2010
27.118K
+2.853K
11.76%
jan 1, 2011
24.558K
-2.56K
-9.44%
jan 1, 2012
23.859K
-699.0
-2.85%
jan 1, 2013
24.699K
+840.0
3.52%
jan 1, 2014
26.764K
+2.065K
8.36%
Ranking of countries by current statistics by years


Comments: