29
/
en
AIzaSyAYiBZKx7MnpbEhh9jyipgxe19OcubqV5w
April 1, 2024
207732
Netherlands
NLD
true
2
1
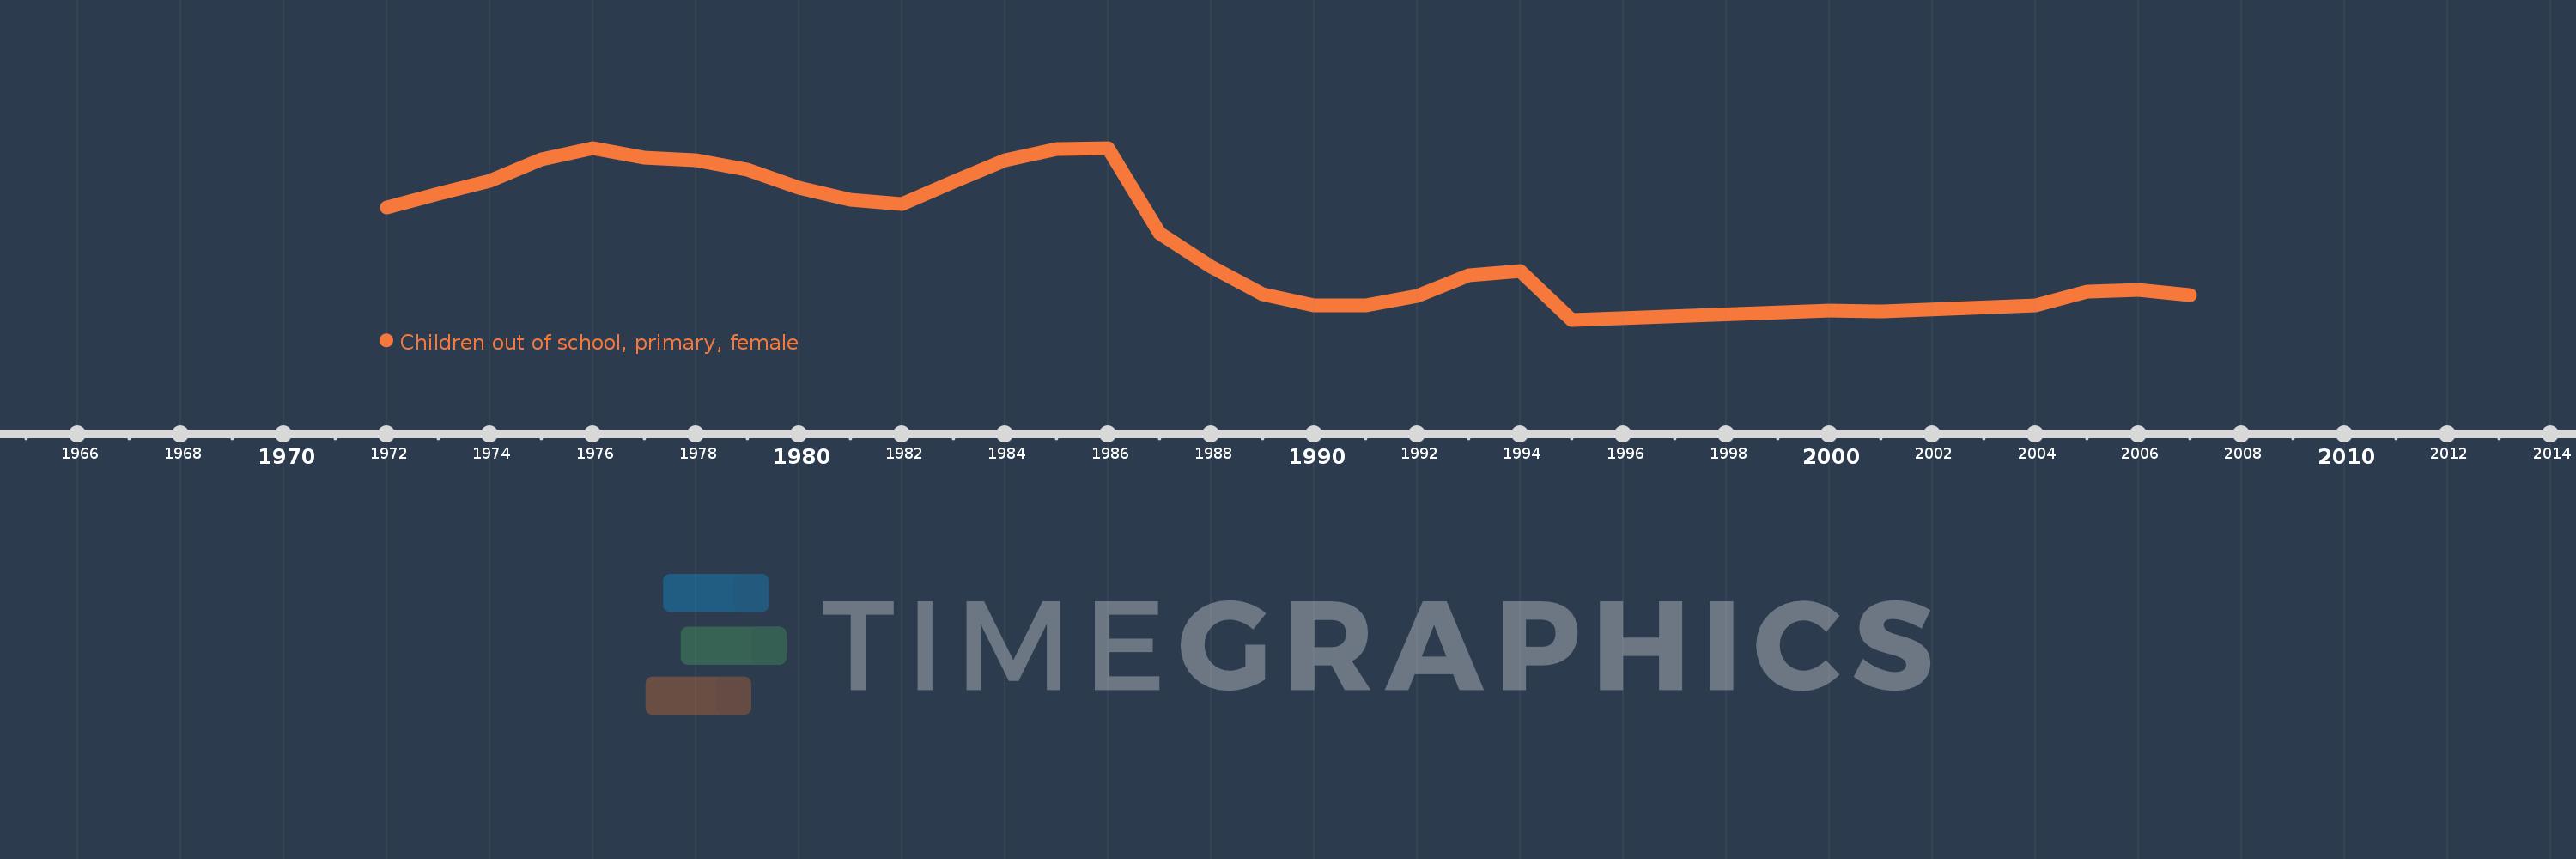
Children out of school, primary, female
2007,2006,2005,2004,2001,2000,1995,1994,1993,1992,1991,1990,1989,1988,1987,1986,1985,1984,1983,1982,1981,1980,1979,1978,1977,1976,1975,1974,1973,1972
This statistics in other country:
AfghanistanAlbaniaAlgeriaAngolaAntigua and BarbudaArab WorldArgentinaArmeniaArubaAustraliaAustriaAzerbaijanBahamas, TheBahrainBangladeshBarbadosBelarusBelgiumBelizeBeninBermudaBhutanBoliviaBosnia and HerzegovinaBotswanaBrazilBrunei DarussalamBulgariaBurkina FasoBurundiCabo VerdeCambodiaCameroonCanadaCaribbean small statesCentral African RepublicCentral Europe and the BalticsChadChileChinaColombiaComorosCongo, Dem. Rep.Congo, Rep.Costa RicaCote d'IvoireCroatiaCubaCyprusDenmarkDjiboutiDominicaDominican RepublicEarly-demographic dividendEast Asia & PacificEast Asia & Pacific (excluding high income)East Asia & Pacific (IDA & IBRD countries)EcuadorEgypt, Arab Rep.El SalvadorEquatorial GuineaEritreaEstoniaEthiopiaEuro areaEurope & Central AsiaEurope & Central Asia (excluding high income)Europe & Central Asia (IDA & IBRD countries)European UnionFijiFinlandFragile and conflict affected situationsFranceGabonGambia, TheGeorgiaGhanaGreeceGrenadaGuatemalaGuineaGuinea-BissauGuyanaHaitiHeavily indebted poor countries (HIPC)High incomeHondurasHong Kong SAR, ChinaHungaryIBRD onlyIcelandIDA & IBRD totalIDA blendIDA onlyIDA totalIndiaIndonesiaIran, Islamic Rep.IraqIrelandIsraelItalyJamaicaJapanJordanKazakhstanKenyaKiribatiKorea, Dem. People’s Rep.Korea, Rep.KuwaitKyrgyz RepublicLao PDRLate-demographic dividendLatin America & Caribbean Latin America & Caribbean (excluding high income)Latin America & the Caribbean (IDA & IBRD countries)LatviaLeast developed countries: UN classificationLebanonLesothoLiberiaLibyaLiechtensteinLithuaniaLow & middle incomeLow incomeLower middle incomeLuxembourgMacao SAR, ChinaMacedonia, FYRMadagascarMalawiMaldivesMaliMaltaMarshall IslandsMauritaniaMauritiusMexicoMicronesia, Fed. Sts.Middle East & North AfricaMiddle East & North Africa (excluding high income)Middle East & North Africa (IDA & IBRD countries)Middle incomeMoldovaMongoliaMontenegroMoroccoMozambiqueMyanmarNamibiaNauruNepalNetherlandsNew ZealandNicaraguaNigerNigeriaNorth AmericaNorwayOECD membersOmanOther small statesPacific island small statesPakistanPanamaPapua New GuineaParaguayPeruPhilippinesPolandPortugalPost-demographic dividendPre-demographic dividendPuerto RicoQatarRomaniaRussian FederationRwandaSamoaSan MarinoSao Tome and PrincipeSaudi ArabiaSenegalSerbiaSeychellesSierra LeoneSloveniaSmall statesSolomon IslandsSomaliaSouth AfricaSouth AsiaSouth Asia (IDA & IBRD)South SudanSpainSri LankaSt. Kitts and NevisSt. LuciaSt. Vincent and the GrenadinesSub-Saharan Africa Sub-Saharan Africa (excluding high income)Sub-Saharan Africa (IDA & IBRD countries)SudanSurinameSwazilandSwedenSwitzerlandSyrian Arab RepublicTajikistanTanzaniaThailandTimor-LesteTogoTongaTrinidad and TobagoTunisiaTurkeyTuvaluUgandaUkraineUnited Arab EmiratesUnited KingdomUnited StatesUpper middle incomeUruguayUzbekistanVanuatuVenezuela, RBWest Bank and GazaWorldYemen, Rep.ZambiaZimbabwe Timeline:
This timeline shows a graph from 1972 to 2007 of Netherlands. No data until 1971. Number of actual observations by date: 30.
Source name:
World Development Indicators
Source organization:
United Nations Educational, Scientific, and Cultural Organization (UNESCO) Institute for Statistics.
Categories, topics:
Education, Gender
Last updated:
apr 23, 2017
Indicators value changes by year
Minimum:
2.873K
jan 1, 1995
Maximum:
64.366K
jan 1, 1986
At the date of observation
Value
Absolute change
Change from previous value
jan 1, 1972
42.917K
+42.917K
0.0%
jan 1, 1973
48.093K
+5.176K
12.06%
jan 1, 1974
52.581K
+4.488K
9.33%
jan 1, 1975
60.266K
+7.685K
14.62%
jan 1, 1976
64.161K
+3.895K
6.46%
jan 1, 1977
60.957K
-3.204K
-4.99%
jan 1, 1978
59.891K
-1.066K
-1.75%
jan 1, 1979
56.508K
-3.383K
-5.65%
jan 1, 1980
50.273K
-6.235K
-11.03%
jan 1, 1981
45.747K
-4.526K
-9.0%
jan 1, 1982
44.323K
-1.424K
-3.11%
jan 1, 1983
52.369K
+8.046K
18.15%
jan 1, 1984
59.93K
+7.561K
14.44%
jan 1, 1985
64.056K
+4.126K
6.88%
jan 1, 1986
64.366K
+310.0
0.48%
jan 1, 1987
33.702K
-30.664K
-47.64%
jan 1, 1988
21.767K
-11.935K
-35.41%
jan 1, 1989
12.112K
-9.655K
-44.36%
jan 1, 1990
8.088K
-4.024K
-33.22%
jan 1, 1991
7.895K
-193.0
-2.39%
jan 1, 1992
11.397K
+3.502K
44.36%
jan 1, 1993
18.81K
+7.413K
65.04%
jan 1, 1994
20.222K
+1.412K
7.51%
jan 1, 1995
2.873K
-17.349K
-85.79%
jan 1, 2000
6.091K
+3.218K
112.01%
jan 1, 2001
5.778K
-313.0
-5.14%
jan 1, 2004
8.078K
+2.3K
39.81%
jan 1, 2005
12.9K
+4.822K
59.69%
jan 1, 2006
13.485K
+585.0
4.53%
jan 1, 2007
11.708K
-1.777K
-13.18%
Ranking of countries by current statistics by years


Comments: