29
/
en
AIzaSyAYiBZKx7MnpbEhh9jyipgxe19OcubqV5w
April 1, 2024
227214
Qatar
QAT
true
2
1
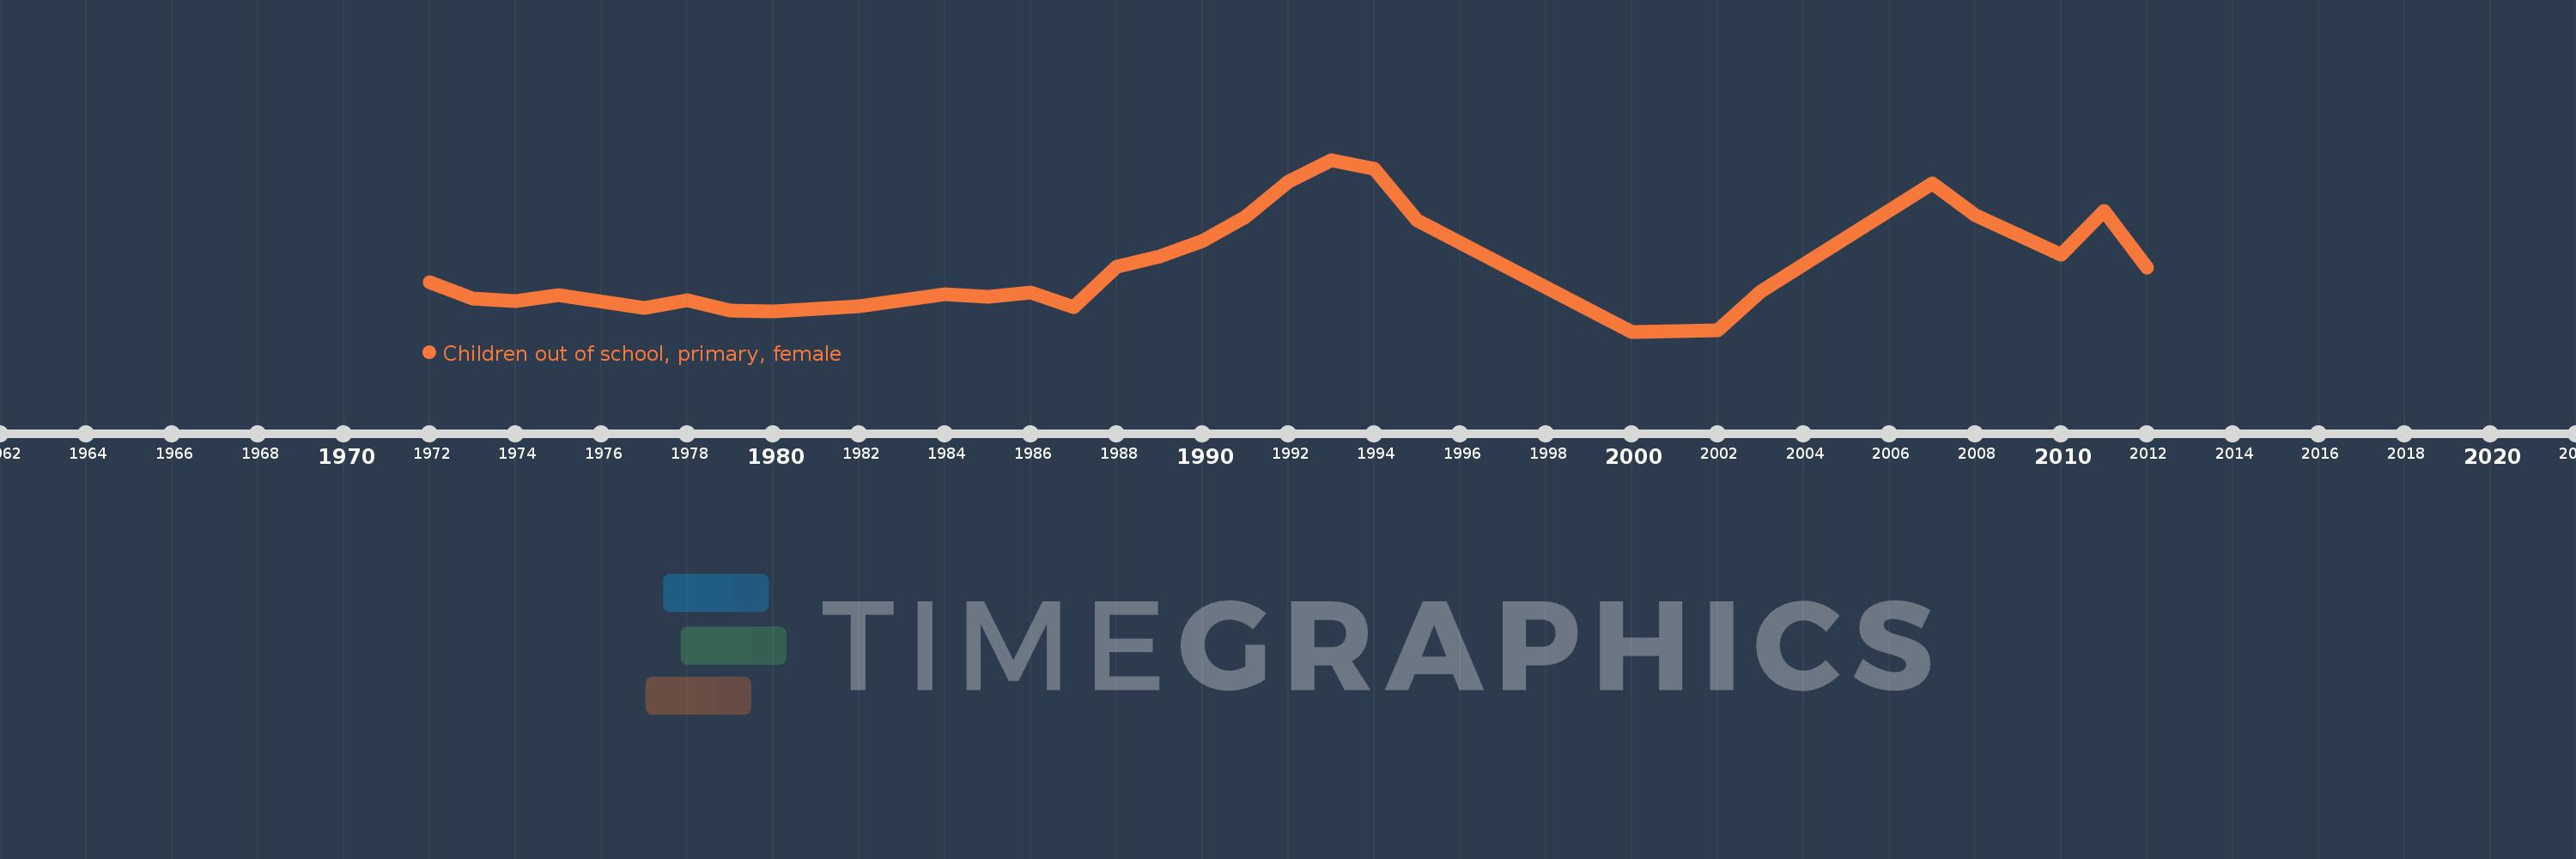
Children out of school, primary, female
2012,2011,2010,2008,2007,2003,2002,2001,2000,1995,1994,1993,1992,1991,1990,1989,1988,1987,1986,1985,1984,1982,1980,1979,1978,1977,1975,1974,1973,1972
This statistics in other country:
AfghanistanAlbaniaAlgeriaAngolaAntigua and BarbudaArab WorldArgentinaArmeniaArubaAustraliaAustriaAzerbaijanBahamas, TheBahrainBangladeshBarbadosBelarusBelgiumBelizeBeninBermudaBhutanBoliviaBosnia and HerzegovinaBotswanaBrazilBrunei DarussalamBulgariaBurkina FasoBurundiCabo VerdeCambodiaCameroonCanadaCaribbean small statesCentral African RepublicCentral Europe and the BalticsChadChileChinaColombiaComorosCongo, Dem. Rep.Congo, Rep.Costa RicaCote d'IvoireCroatiaCubaCyprusDenmarkDjiboutiDominicaDominican RepublicEarly-demographic dividendEast Asia & PacificEast Asia & Pacific (excluding high income)East Asia & Pacific (IDA & IBRD countries)EcuadorEgypt, Arab Rep.El SalvadorEquatorial GuineaEritreaEstoniaEthiopiaEuro areaEurope & Central AsiaEurope & Central Asia (excluding high income)Europe & Central Asia (IDA & IBRD countries)European UnionFijiFinlandFragile and conflict affected situationsFranceGabonGambia, TheGeorgiaGhanaGreeceGrenadaGuatemalaGuineaGuinea-BissauGuyanaHaitiHeavily indebted poor countries (HIPC)High incomeHondurasHong Kong SAR, ChinaHungaryIBRD onlyIcelandIDA & IBRD totalIDA blendIDA onlyIDA totalIndiaIndonesiaIran, Islamic Rep.IraqIrelandIsraelItalyJamaicaJapanJordanKazakhstanKenyaKiribatiKorea, Dem. People’s Rep.Korea, Rep.KuwaitKyrgyz RepublicLao PDRLate-demographic dividendLatin America & Caribbean Latin America & Caribbean (excluding high income)Latin America & the Caribbean (IDA & IBRD countries)LatviaLeast developed countries: UN classificationLebanonLesothoLiberiaLibyaLiechtensteinLithuaniaLow & middle incomeLow incomeLower middle incomeLuxembourgMacao SAR, ChinaMacedonia, FYRMadagascarMalawiMaldivesMaliMaltaMarshall IslandsMauritaniaMauritiusMexicoMicronesia, Fed. Sts.Middle East & North AfricaMiddle East & North Africa (excluding high income)Middle East & North Africa (IDA & IBRD countries)Middle incomeMoldovaMongoliaMontenegroMoroccoMozambiqueMyanmarNamibiaNauruNepalNetherlandsNew ZealandNicaraguaNigerNigeriaNorth AmericaNorwayOECD membersOmanOther small statesPacific island small statesPakistanPanamaPapua New GuineaParaguayPeruPhilippinesPolandPortugalPost-demographic dividendPre-demographic dividendPuerto RicoQatarRomaniaRussian FederationRwandaSamoaSan MarinoSao Tome and PrincipeSaudi ArabiaSenegalSerbiaSeychellesSierra LeoneSloveniaSmall statesSolomon IslandsSomaliaSouth AfricaSouth AsiaSouth Asia (IDA & IBRD)South SudanSpainSri LankaSt. Kitts and NevisSt. LuciaSt. Vincent and the GrenadinesSub-Saharan Africa Sub-Saharan Africa (excluding high income)Sub-Saharan Africa (IDA & IBRD countries)SudanSurinameSwazilandSwedenSwitzerlandSyrian Arab RepublicTajikistanTanzaniaThailandTimor-LesteTogoTongaTrinidad and TobagoTunisiaTurkeyTuvaluUgandaUkraineUnited Arab EmiratesUnited KingdomUnited StatesUpper middle incomeUruguayUzbekistanVanuatuVenezuela, RBWest Bank and GazaWorldYemen, Rep.ZambiaZimbabwe Timeline:
This timeline shows a graph from 1972 to 2012 of Qatar. No data until 1971. Number of actual observations by date: 30.
Source name:
World Development Indicators
Source organization:
United Nations Educational, Scientific, and Cultural Organization (UNESCO) Institute for Statistics.
Categories, topics:
Education, Gender
Last updated:
apr 23, 2017
Indicators value changes by year
Maximum:
5.838K
jan 1, 1993
At the date of observation
Value
Absolute change
Change from previous value
jan 1, 1972
1.706K
+1.706K
0.0%
jan 1, 1973
1.163K
-543.0
-31.83%
jan 1, 1974
1.087K
-76.0
-6.53%
jan 1, 1975
1.273K
+186.0
17.11%
jan 1, 1977
845.0
-428.0
-33.62%
jan 1, 1978
1.097K
+252.0
29.82%
jan 1, 1979
759.0
-338.0
-30.81%
jan 1, 1980
737.0
-22.0
-2.9%
jan 1, 1982
916.0
+179.0
24.29%
jan 1, 1984
1.321K
+405.0
44.21%
jan 1, 1985
1.211K
-110.0
-8.33%
jan 1, 1986
1.365K
+154.0
12.72%
jan 1, 1987
887.0
-478.0
-35.02%
jan 1, 1988
2.229K
+1.342K
151.3%
jan 1, 1989
2.573K
+344.0
15.43%
jan 1, 1990
3.102K
+529.0
20.56%
jan 1, 1991
3.909K
+807.0
26.02%
jan 1, 1992
5.092K
+1.183K
30.26%
jan 1, 1993
5.838K
+746.0
14.65%
jan 1, 1994
5.537K
-301.0
-5.16%
jan 1, 1995
3.808K
-1.729K
-31.23%
jan 1, 2000
50.0
-3.758K
-98.69%
jan 1, 2001
57.0
+7.0
14.0%
jan 1, 2002
94.0
+37.0
64.91%
jan 1, 2003
1.4K
+1.306K
1.39K%
jan 1, 2007
5.035K
+3.635K
259.64%
jan 1, 2008
3.969K
-1.066K
-21.17%
jan 1, 2010
2.635K
-1.334K
-33.61%
jan 1, 2011
4.104K
+1.469K
55.75%
jan 1, 2012
2.192K
-1.912K
-46.59%
Ranking of countries by current statistics by years


Comments: