29
/
en
AIzaSyAYiBZKx7MnpbEhh9jyipgxe19OcubqV5w
April 1, 2024
33275
European Union
EUU
false
2
1
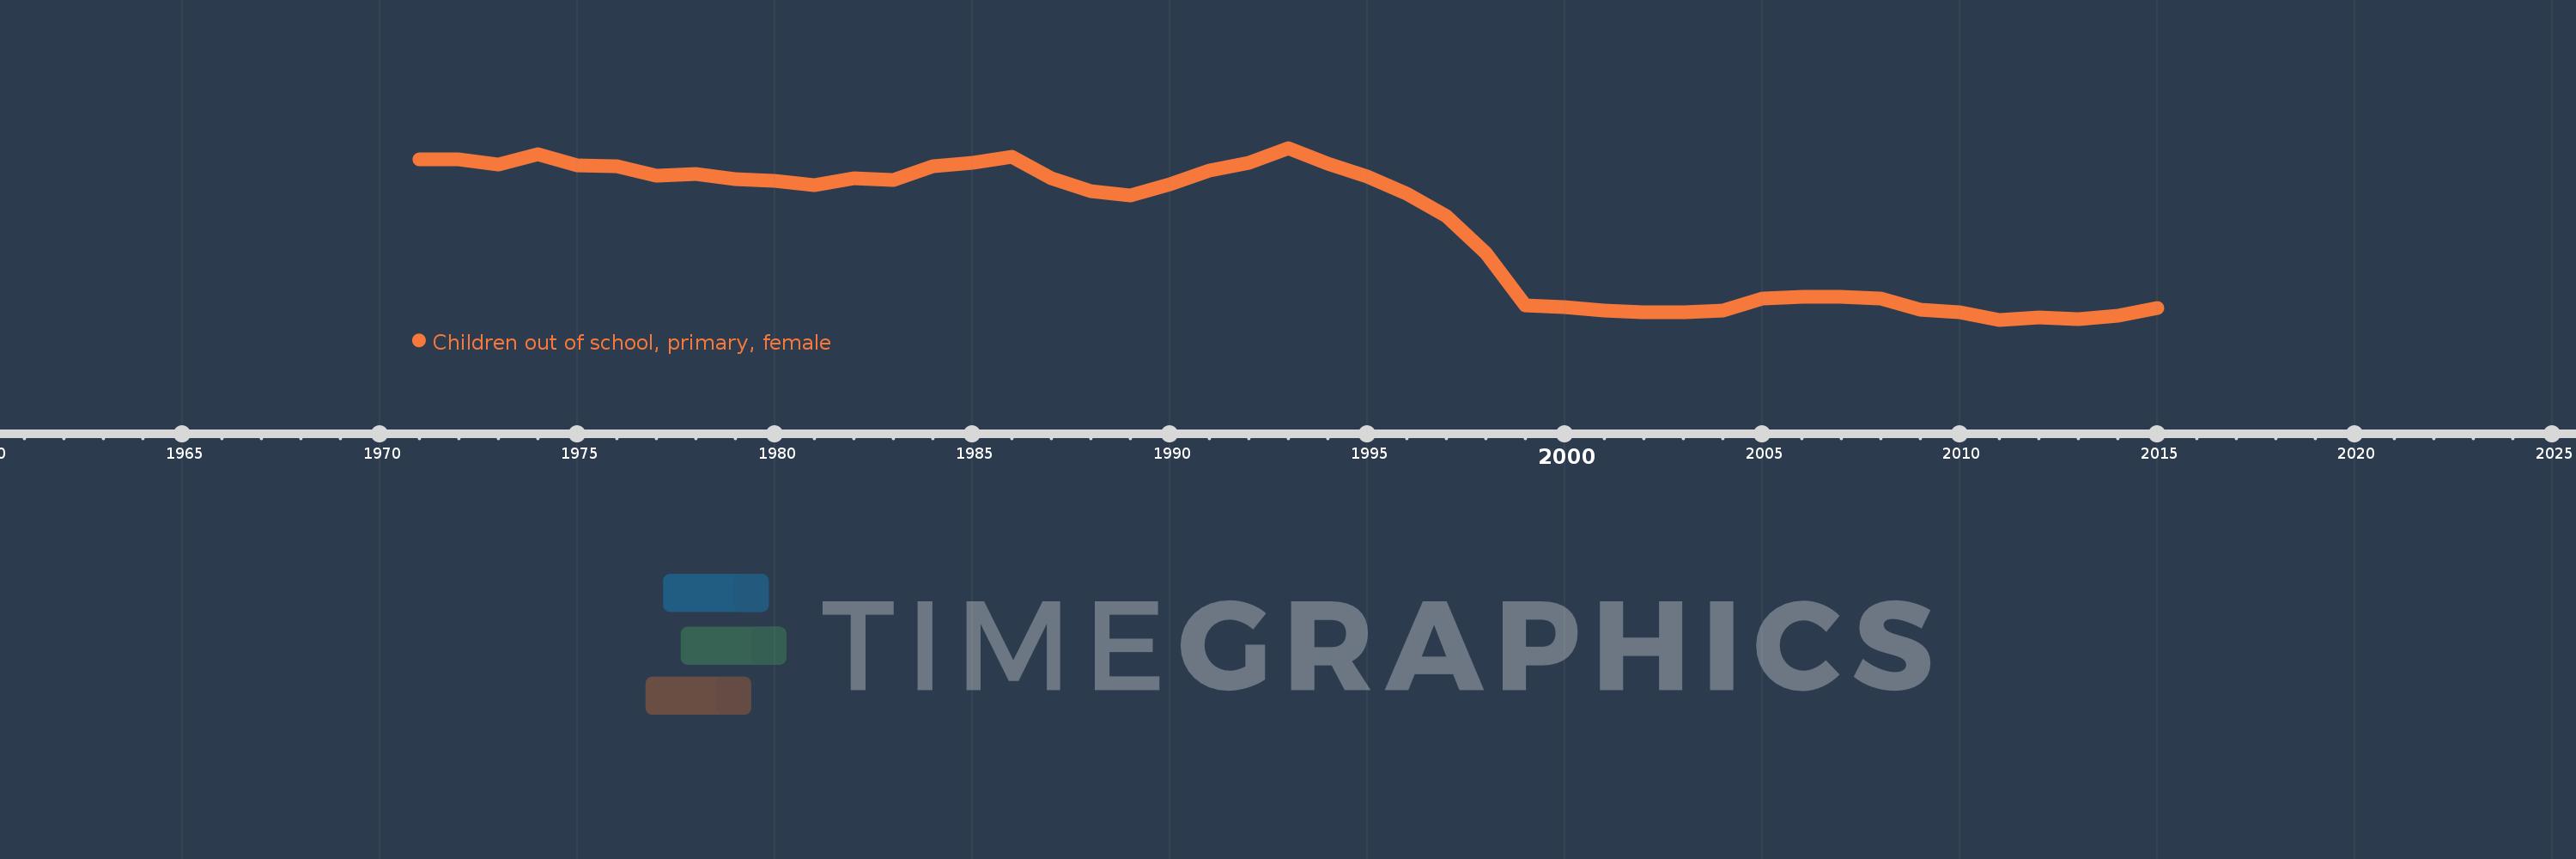
Children out of school, primary, female
2015,2014,2013,2012,2011,2010,2009,2008,2007,2006,2005,2004,2003,2002,2001,2000,1999,1998,1997,1996,1995,1994,1993,1992,1991,1990,1989,1988,1987,1986,1985,1984,1983,1982,1981,1980,1979,1978,1977,1976,1975,1974,1973,1972,1971
This statistics in other country:
AfghanistanAlbaniaAlgeriaAngolaAntigua and BarbudaArab WorldArgentinaArmeniaArubaAustraliaAustriaAzerbaijanBahamas, TheBahrainBangladeshBarbadosBelarusBelgiumBelizeBeninBermudaBhutanBoliviaBosnia and HerzegovinaBotswanaBrazilBrunei DarussalamBulgariaBurkina FasoBurundiCabo VerdeCambodiaCameroonCanadaCaribbean small statesCentral African RepublicCentral Europe and the BalticsChadChileChinaColombiaComorosCongo, Dem. Rep.Congo, Rep.Costa RicaCote d'IvoireCroatiaCubaCyprusDenmarkDjiboutiDominicaDominican RepublicEarly-demographic dividendEast Asia & PacificEast Asia & Pacific (excluding high income)East Asia & Pacific (IDA & IBRD countries)EcuadorEgypt, Arab Rep.El SalvadorEquatorial GuineaEritreaEstoniaEthiopiaEuro areaEurope & Central AsiaEurope & Central Asia (excluding high income)Europe & Central Asia (IDA & IBRD countries)European UnionFijiFinlandFragile and conflict affected situationsFranceGabonGambia, TheGeorgiaGhanaGreeceGrenadaGuatemalaGuineaGuinea-BissauGuyanaHaitiHeavily indebted poor countries (HIPC)High incomeHondurasHong Kong SAR, ChinaHungaryIBRD onlyIcelandIDA & IBRD totalIDA blendIDA onlyIDA totalIndiaIndonesiaIran, Islamic Rep.IraqIrelandIsraelItalyJamaicaJapanJordanKazakhstanKenyaKiribatiKorea, Dem. People’s Rep.Korea, Rep.KuwaitKyrgyz RepublicLao PDRLate-demographic dividendLatin America & Caribbean Latin America & Caribbean (excluding high income)Latin America & the Caribbean (IDA & IBRD countries)LatviaLeast developed countries: UN classificationLebanonLesothoLiberiaLibyaLiechtensteinLithuaniaLow & middle incomeLow incomeLower middle incomeLuxembourgMacao SAR, ChinaMacedonia, FYRMadagascarMalawiMaldivesMaliMaltaMarshall IslandsMauritaniaMauritiusMexicoMicronesia, Fed. Sts.Middle East & North AfricaMiddle East & North Africa (excluding high income)Middle East & North Africa (IDA & IBRD countries)Middle incomeMoldovaMongoliaMontenegroMoroccoMozambiqueMyanmarNamibiaNauruNepalNetherlandsNew ZealandNicaraguaNigerNigeriaNorth AmericaNorwayOECD membersOmanOther small statesPacific island small statesPakistanPanamaPapua New GuineaParaguayPeruPhilippinesPolandPortugalPost-demographic dividendPre-demographic dividendPuerto RicoQatarRomaniaRussian FederationRwandaSamoaSan MarinoSao Tome and PrincipeSaudi ArabiaSenegalSerbiaSeychellesSierra LeoneSloveniaSmall statesSolomon IslandsSomaliaSouth AfricaSouth AsiaSouth Asia (IDA & IBRD)South SudanSpainSri LankaSt. Kitts and NevisSt. LuciaSt. Vincent and the GrenadinesSub-Saharan Africa Sub-Saharan Africa (excluding high income)Sub-Saharan Africa (IDA & IBRD countries)SudanSurinameSwazilandSwedenSwitzerlandSyrian Arab RepublicTajikistanTanzaniaThailandTimor-LesteTogoTongaTrinidad and TobagoTunisiaTurkeyTuvaluUgandaUkraineUnited Arab EmiratesUnited KingdomUnited StatesUpper middle incomeUruguayUzbekistanVanuatuVenezuela, RBWest Bank and GazaWorldYemen, Rep.ZambiaZimbabwe Timeline:
This timeline shows a graph from 1971 to 2015 of European Union. No data until 1970. Number of actual observations by date: 45.
Source name:
World Development Indicators
Source organization:
United Nations Educational, Scientific, and Cultural Organization (UNESCO) Institute for Statistics.
Categories, topics:
Education, Gender
Last updated:
apr 23, 2017
Indicators value changes by year
Minimum:
161.032K
jan 1, 2011
Maximum:
781.541K
jan 1, 1993
At the date of observation
Value
Absolute change
Change from previous value
jan 1, 1971
741.287K
+741.287K
0.0%
jan 1, 1972
740.748K
-539.0
-0.07%
jan 1, 1973
721.763K
-18.985K
-2.56%
jan 1, 1974
757.445K
+35.682K
4.94%
jan 1, 1975
719.546K
-37.899K
-5.0%
jan 1, 1976
715.197K
-4.349K
-0.6%
jan 1, 1977
680.278K
-34.919K
-4.88%
jan 1, 1978
687.442K
+7.164K
1.05%
jan 1, 1979
670.308K
-17.134K
-2.49%
jan 1, 1980
661.693K
-8.615K
-1.29%
jan 1, 1981
646.442K
-15.251K
-2.3%
jan 1, 1982
673.548K
+27.106K
4.19%
jan 1, 1983
665.071K
-8.477K
-1.26%
jan 1, 1984
715.627K
+50.556K
7.6%
jan 1, 1985
727.279K
+11.652K
1.63%
jan 1, 1986
749.749K
+22.47K
3.09%
jan 1, 1987
673.183K
-76.566K
-10.21%
jan 1, 1988
626.192K
-46.991K
-6.98%
jan 1, 1989
611.52K
-14.672K
-2.34%
jan 1, 1990
648.918K
+37.398K
6.12%
jan 1, 1991
698.651K
+49.733K
7.66%
jan 1, 1992
729.012K
+30.361K
4.35%
jan 1, 1993
781.541K
+52.529K
7.21%
jan 1, 1994
724.991K
-56.55K
-7.24%
jan 1, 1995
678.059K
-46.932K
-6.47%
jan 1, 1996
615.102K
-62.957K
-9.28%
jan 1, 1997
534.852K
-80.25K
-13.05%
jan 1, 1998
401.29K
-133.562K
-24.97%
jan 1, 1999
211.884K
-189.406K
-47.2%
jan 1, 2000
205.528K
-6.356K
-3.0%
jan 1, 2001
195.239K
-10.289K
-5.01%
jan 1, 2002
188.75K
-6.489K
-3.32%
jan 1, 2003
187.329K
-1.421K
-0.75%
jan 1, 2004
195.376K
+8.047K
4.3%
jan 1, 2005
236.922K
+41.546K
21.26%
jan 1, 2006
245.253K
+8.331K
3.52%
jan 1, 2007
244.15K
-1.103K
-0.45%
jan 1, 2008
238.892K
-5.258K
-2.15%
jan 1, 2009
195.933K
-42.959K
-17.98%
jan 1, 2010
189.345K
-6.588K
-3.36%
jan 1, 2011
161.032K
-28.313K
-14.95%
jan 1, 2012
169.522K
+8.49K
5.27%
jan 1, 2013
162.674K
-6.848K
-4.04%
jan 1, 2014
177.147K
+14.473K
8.9%
jan 1, 2015
202.346K
+25.199K
14.22%
Ranking of countries by current statistics by years


Comments: