29
/
en
AIzaSyAYiBZKx7MnpbEhh9jyipgxe19OcubqV5w
April 1, 2024
27920
East Asia & Pacific (excluding high income)
EAP
false
2
1
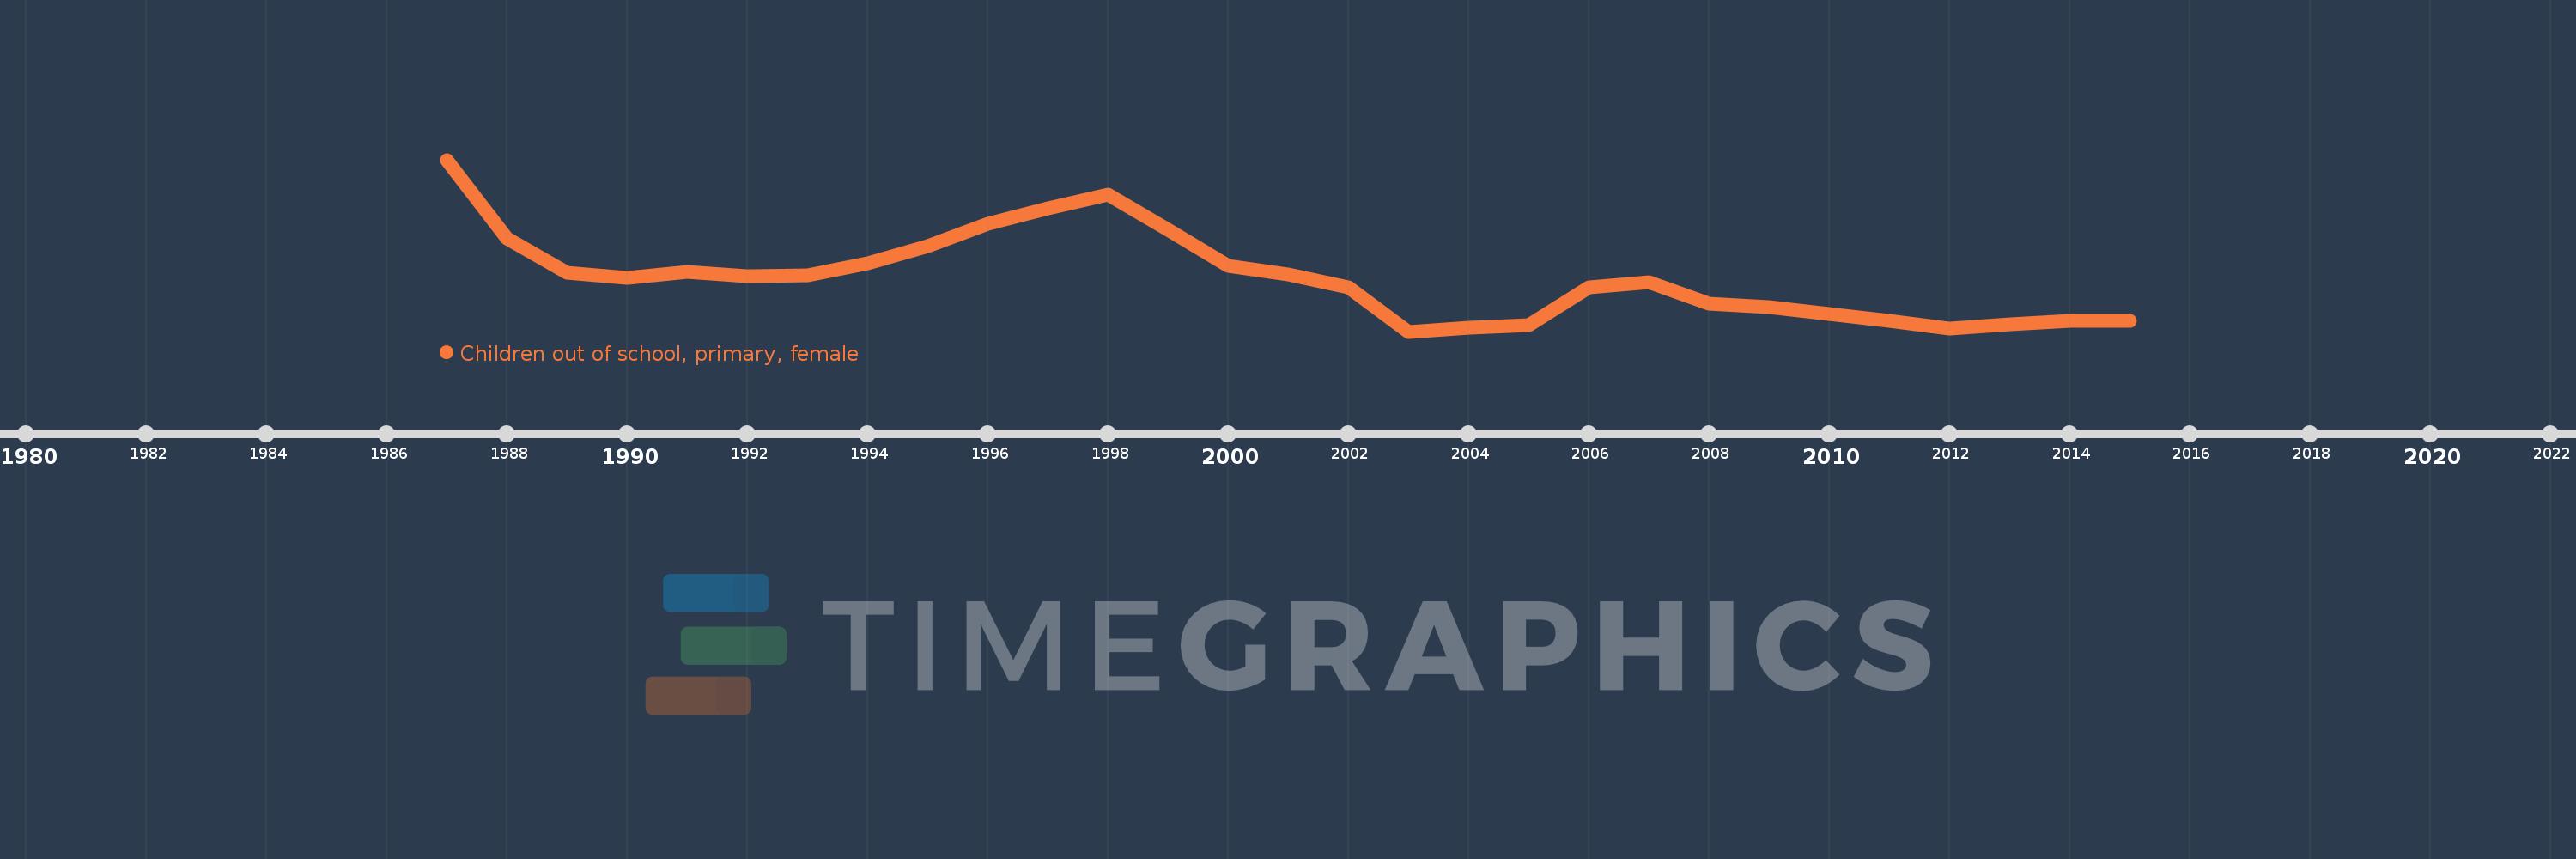
Children out of school, primary, female
2015,2014,2013,2012,2011,2010,2009,2008,2007,2006,2005,2004,2003,2002,2001,2000,1999,1998,1997,1996,1995,1994,1993,1992,1991,1990,1989,1988,1987
This statistics in other country:
AfghanistanAlbaniaAlgeriaAngolaAntigua and BarbudaArab WorldArgentinaArmeniaArubaAustraliaAustriaAzerbaijanBahamas, TheBahrainBangladeshBarbadosBelarusBelgiumBelizeBeninBermudaBhutanBoliviaBosnia and HerzegovinaBotswanaBrazilBrunei DarussalamBulgariaBurkina FasoBurundiCabo VerdeCambodiaCameroonCanadaCaribbean small statesCentral African RepublicCentral Europe and the BalticsChadChileChinaColombiaComorosCongo, Dem. Rep.Congo, Rep.Costa RicaCote d'IvoireCroatiaCubaCyprusDenmarkDjiboutiDominicaDominican RepublicEarly-demographic dividendEast Asia & PacificEast Asia & Pacific (excluding high income)East Asia & Pacific (IDA & IBRD countries)EcuadorEgypt, Arab Rep.El SalvadorEquatorial GuineaEritreaEstoniaEthiopiaEuro areaEurope & Central AsiaEurope & Central Asia (excluding high income)Europe & Central Asia (IDA & IBRD countries)European UnionFijiFinlandFragile and conflict affected situationsFranceGabonGambia, TheGeorgiaGhanaGreeceGrenadaGuatemalaGuineaGuinea-BissauGuyanaHaitiHeavily indebted poor countries (HIPC)High incomeHondurasHong Kong SAR, ChinaHungaryIBRD onlyIcelandIDA & IBRD totalIDA blendIDA onlyIDA totalIndiaIndonesiaIran, Islamic Rep.IraqIrelandIsraelItalyJamaicaJapanJordanKazakhstanKenyaKiribatiKorea, Dem. People’s Rep.Korea, Rep.KuwaitKyrgyz RepublicLao PDRLate-demographic dividendLatin America & Caribbean Latin America & Caribbean (excluding high income)Latin America & the Caribbean (IDA & IBRD countries)LatviaLeast developed countries: UN classificationLebanonLesothoLiberiaLibyaLiechtensteinLithuaniaLow & middle incomeLow incomeLower middle incomeLuxembourgMacao SAR, ChinaMacedonia, FYRMadagascarMalawiMaldivesMaliMaltaMarshall IslandsMauritaniaMauritiusMexicoMicronesia, Fed. Sts.Middle East & North AfricaMiddle East & North Africa (excluding high income)Middle East & North Africa (IDA & IBRD countries)Middle incomeMoldovaMongoliaMontenegroMoroccoMozambiqueMyanmarNamibiaNauruNepalNetherlandsNew ZealandNicaraguaNigerNigeriaNorth AmericaNorwayOECD membersOmanOther small statesPacific island small statesPakistanPanamaPapua New GuineaParaguayPeruPhilippinesPolandPortugalPost-demographic dividendPre-demographic dividendPuerto RicoQatarRomaniaRussian FederationRwandaSamoaSan MarinoSao Tome and PrincipeSaudi ArabiaSenegalSerbiaSeychellesSierra LeoneSloveniaSmall statesSolomon IslandsSomaliaSouth AfricaSouth AsiaSouth Asia (IDA & IBRD)South SudanSpainSri LankaSt. Kitts and NevisSt. LuciaSt. Vincent and the GrenadinesSub-Saharan Africa Sub-Saharan Africa (excluding high income)Sub-Saharan Africa (IDA & IBRD countries)SudanSurinameSwazilandSwedenSwitzerlandSyrian Arab RepublicTajikistanTanzaniaThailandTimor-LesteTogoTongaTrinidad and TobagoTunisiaTurkeyTuvaluUgandaUkraineUnited Arab EmiratesUnited KingdomUnited StatesUpper middle incomeUruguayUzbekistanVanuatuVenezuela, RBWest Bank and GazaWorldYemen, Rep.ZambiaZimbabwe Timeline:
This timeline shows a graph from 1987 to 2015 of East Asia & Pacific (excluding high income). No data until 1986. Number of actual observations by date: 29.
Source name:
World Development Indicators
Source organization:
United Nations Educational, Scientific, and Cultural Organization (UNESCO) Institute for Statistics.
Categories, topics:
Education, Gender
Last updated:
apr 23, 2017
Indicators value changes by year
Minimum:
2.444 mln
jan 1, 2003
Maximum:
10.97 mln
jan 1, 1987
At the date of observation
Value
Absolute change
Change from previous value
jan 1, 1987
10.97 mln
+10.97 mln
0.0%
jan 1, 1988
7.077 mln
-3.893 mln
-35.49%
jan 1, 1989
5.361 mln
-1.716 mln
-24.24%
jan 1, 1990
5.109 mln
-251.829K
-4.7%
jan 1, 1991
5.389 mln
+279.485K
5.47%
jan 1, 1992
5.185 mln
-203.637K
-3.78%
jan 1, 1993
5.221 mln
+35.343K
0.68%
jan 1, 1994
5.817 mln
+596.686K
11.43%
jan 1, 1995
6.667 mln
+850.092K
14.61%
jan 1, 1996
7.799 mln
+1.132 mln
16.97%
jan 1, 1997
8.581 mln
+781.827K
10.02%
jan 1, 1998
9.235 mln
+654.646K
7.63%
jan 1, 1999
7.512 mln
-1.724 mln
-18.67%
jan 1, 2000
5.702 mln
-1.81 mln
-24.09%
jan 1, 2001
5.288 mln
-414.148K
-7.26%
jan 1, 2002
4.623 mln
-664.664K
-12.57%
jan 1, 2003
2.444 mln
-2.18 mln
-47.15%
jan 1, 2004
2.649 mln
+205.096K
8.39%
jan 1, 2005
2.778 mln
+129.45K
4.89%
jan 1, 2006
4.637 mln
+1.859 mln
66.91%
jan 1, 2007
4.904 mln
+266.714K
5.75%
jan 1, 2008
3.814 mln
-1.09 mln
-22.22%
jan 1, 2009
3.678 mln
-135.477K
-3.55%
jan 1, 2010
3.321 mln
-357.49K
-9.72%
jan 1, 2011
2.976 mln
-345.065K
-10.39%
jan 1, 2012
2.58 mln
-395.702K
-13.3%
jan 1, 2013
2.809 mln
+228.88K
8.87%
jan 1, 2014
2.961 mln
+152.425K
5.43%
jan 1, 2015
2.993 mln
+31.959K
1.08%
Ranking of countries by current statistics by years


Comments: