30
/
AIzaSyAYiBZKx7MnpbEhh9jyipgxe19OcubqV5w
April 1, 2024
112620
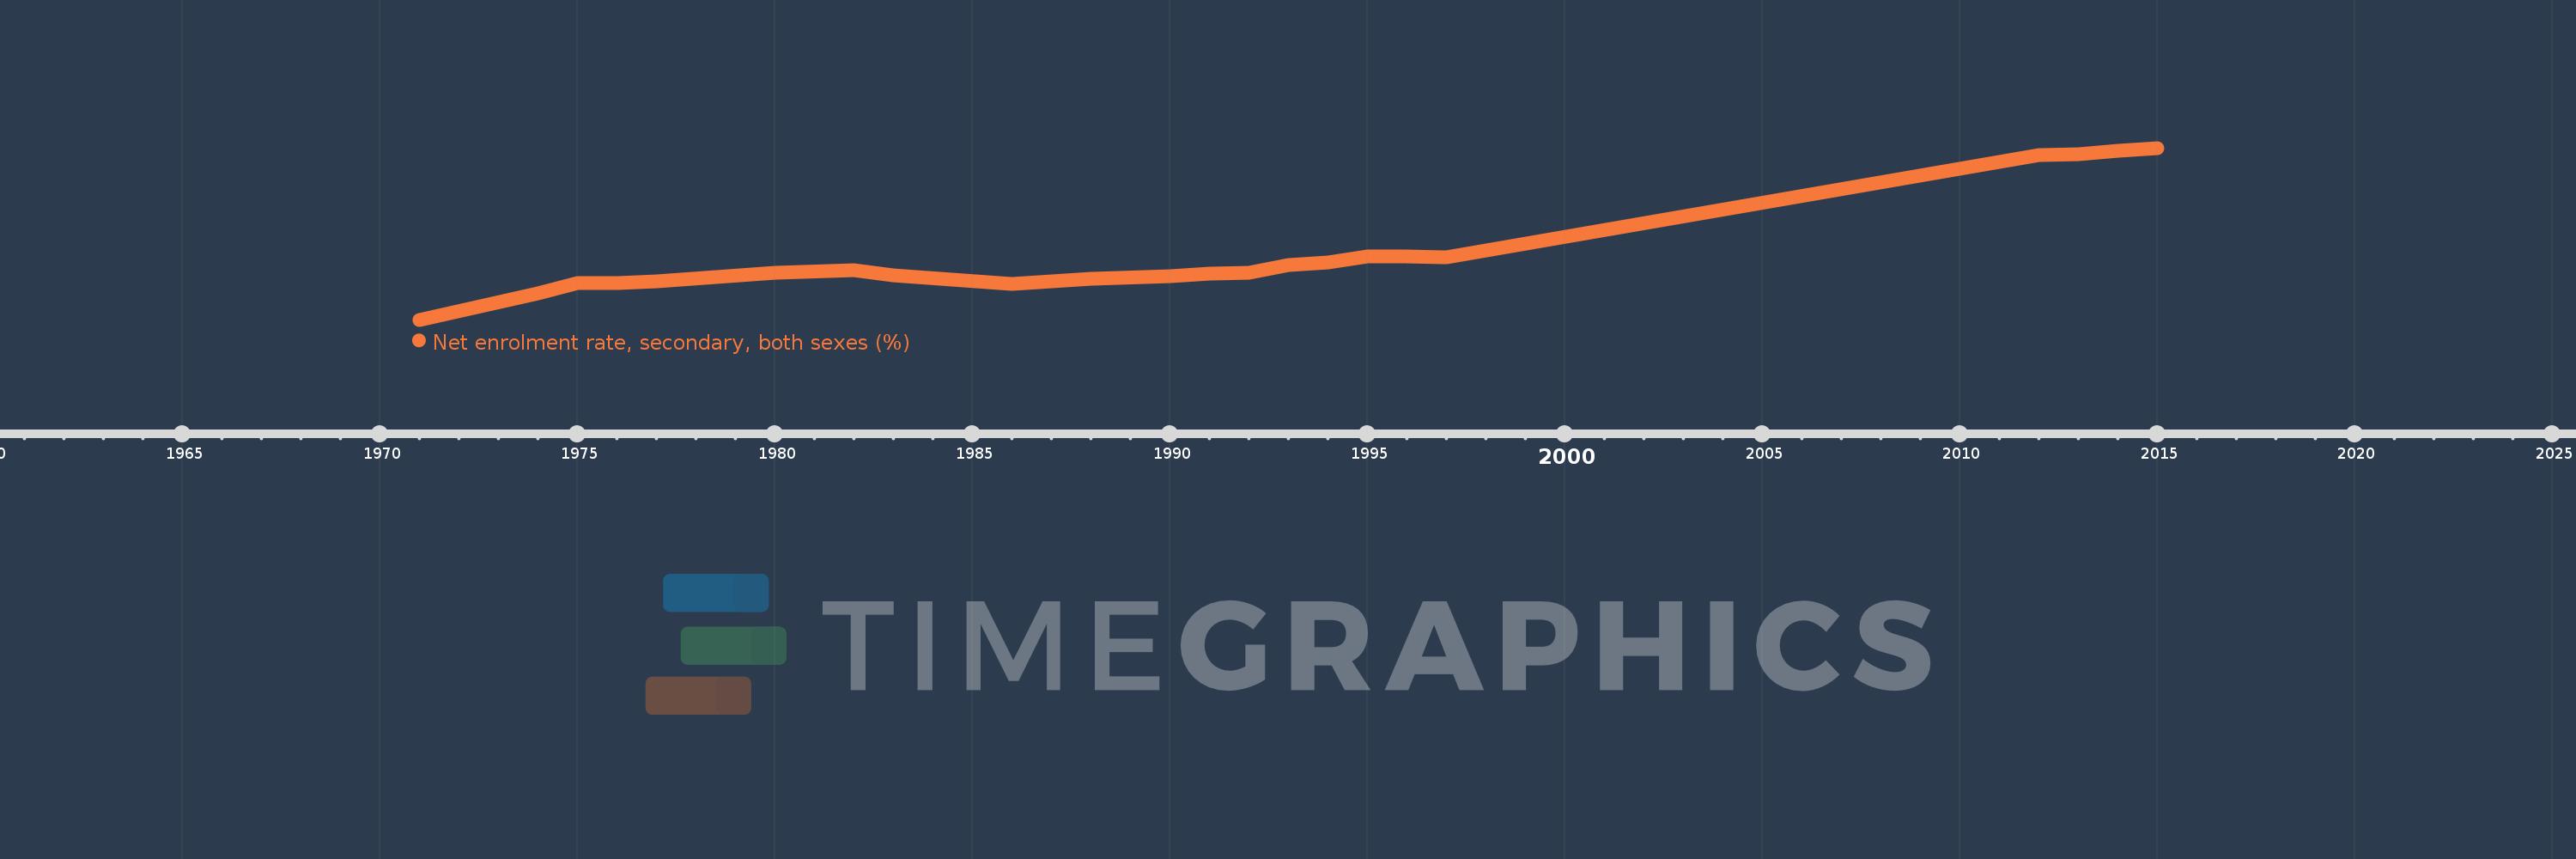
Costa Rica
CRI
true
2
1
Net enrolment rate, secondary, both sexes (%)
2015,2014,2013,2012,1997,1996,1995,1994,1993,1992,1991,1990,1988,1987,1986,1983,1982,1980,1977,1976,1975,1974,1971
