29
/
en
AIzaSyAYiBZKx7MnpbEhh9jyipgxe19OcubqV5w
April 1, 2024
24356
Arab World
ARB
false
2
1
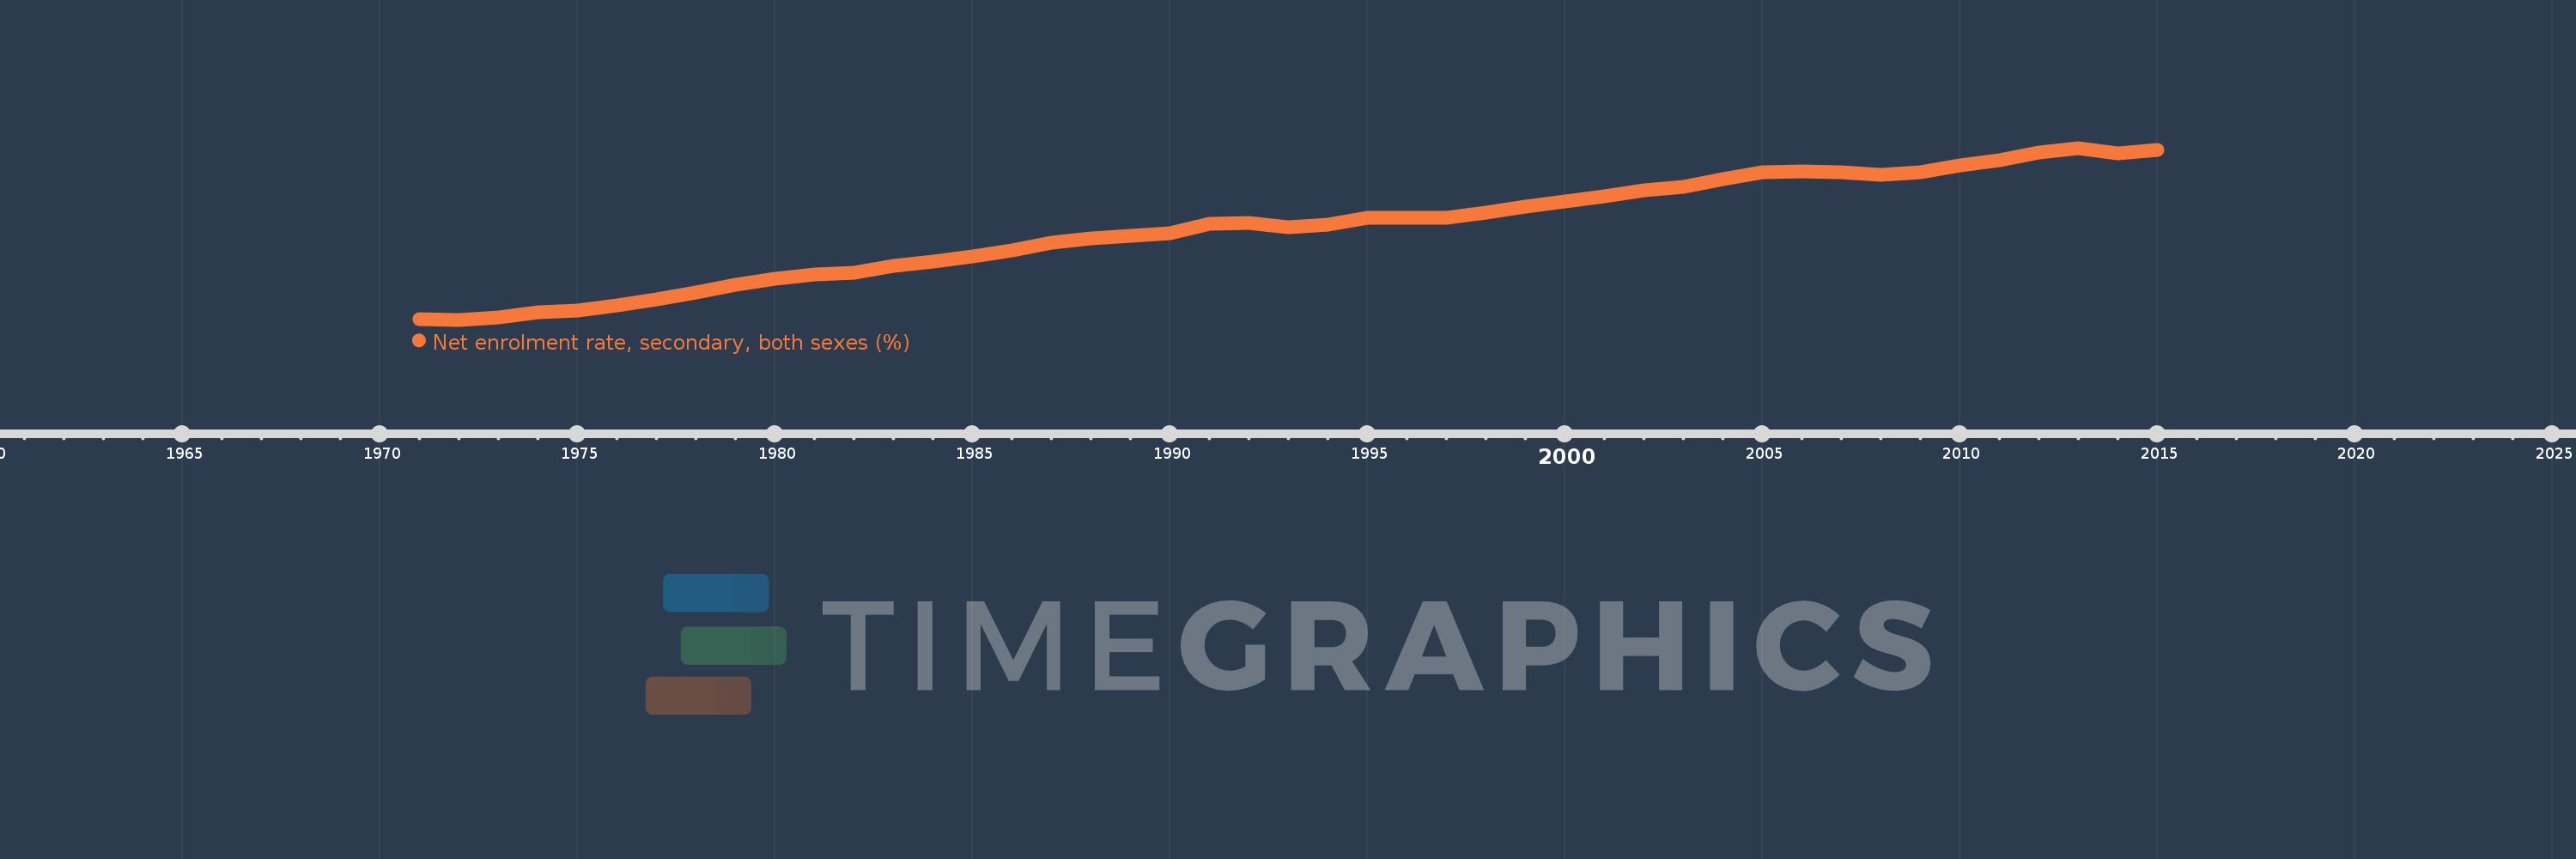
Net enrolment rate, secondary, both sexes (%)
2015,2014,2013,2012,2011,2010,2009,2008,2007,2006,2005,2004,2003,2002,2001,2000,1999,1998,1997,1996,1995,1994,1993,1992,1991,1990,1989,1988,1987,1986,1985,1984,1983,1982,1981,1980,1979,1978,1977,1976,1975,1974,1973,1972,1971
This statistics in other country:
AfghanistanAlbaniaAlgeriaAngolaAntigua and BarbudaArab WorldArgentinaArmeniaArubaAustraliaAustriaAzerbaijanBahamas, TheBahrainBangladeshBarbadosBelarusBelgiumBelizeBeninBermudaBhutanBoliviaBotswanaBrazilBritish Virgin IslandsBrunei DarussalamBulgariaBurkina FasoBurundiCabo VerdeCambodiaCameroonCanadaCaribbean small statesCentral African RepublicCentral Europe and the BalticsChadChileColombiaComorosCongo, Dem. Rep.Congo, Rep.Costa RicaCroatiaCubaCyprusDenmarkDjiboutiDominicaDominican RepublicEarly-demographic dividendEast Asia & PacificEast Asia & Pacific (excluding high income)East Asia & Pacific (IDA & IBRD countries)EcuadorEgypt, Arab Rep.El SalvadorEquatorial GuineaEritreaEstoniaEthiopiaEuro areaEurope & Central AsiaEurope & Central Asia (excluding high income)Europe & Central Asia (IDA & IBRD countries)European UnionFijiFinlandFragile and conflict affected situationsFranceGambia, TheGeorgiaGhanaGreeceGrenadaGuatemalaGuineaGuinea-BissauGuyanaHeavily indebted poor countries (HIPC)High incomeHondurasHong Kong SAR, ChinaHungaryIBRD onlyIcelandIDA & IBRD totalIDA blendIDA onlyIDA totalIndiaIndonesiaIran, Islamic Rep.IraqIrelandIsraelItalyJamaicaJapanJordanKazakhstanKenyaKiribatiKorea, Dem. People’s Rep.Korea, Rep.KuwaitKyrgyz RepublicLao PDRLate-demographic dividendLatin America & Caribbean Latin America & Caribbean (excluding high income)Latin America & the Caribbean (IDA & IBRD countries)LatviaLeast developed countries: UN classificationLebanonLesothoLibyaLiechtensteinLithuaniaLow & middle incomeLow incomeLower middle incomeLuxembourgMacao SAR, ChinaMacedonia, FYRMadagascarMalawiMalaysiaMaldivesMaliMaltaMarshall IslandsMauritaniaMauritiusMexicoMiddle East & North AfricaMiddle East & North Africa (excluding high income)Middle East & North Africa (IDA & IBRD countries)Middle incomeMoldovaMongoliaMoroccoMozambiqueMyanmarNamibiaNauruNepalNetherlandsNew ZealandNicaraguaNigerNorth AmericaNorwayOECD membersOmanOther small statesPacific island small statesPakistanPanamaParaguayPeruPhilippinesPolandPortugalPost-demographic dividendPre-demographic dividendPuerto RicoQatarRomaniaSamoaSao Tome and PrincipeSaudi ArabiaSenegalSerbiaSeychellesSierra LeoneSloveniaSmall statesSolomon IslandsSomaliaSouth AfricaSouth AsiaSouth Asia (IDA & IBRD)SpainSri LankaSt. Kitts and NevisSt. LuciaSt. Vincent and the GrenadinesSub-Saharan Africa Sub-Saharan Africa (excluding high income)Sub-Saharan Africa (IDA & IBRD countries)SurinameSwazilandSwedenSwitzerlandSyrian Arab RepublicTajikistanThailandTimor-LesteTogoTongaTrinidad and TobagoTunisiaTurkeyTuvaluUgandaUkraineUnited Arab EmiratesUnited KingdomUnited StatesUpper middle incomeUruguayVanuatuVenezuela, RBVietnamWest Bank and GazaWorldYemen, Rep.Zimbabwe Timeline:
This timeline shows a graph from 1971 to 2015 of Arab World. No data until 1970. Number of actual observations by date: 45.
Source name:
World Development Indicators
Source organization:
UNESCO Institute for Statistics
Categories, topics:
Education
Last updated:
apr 23, 2017
Indicators value changes by year
Minimum:
21.011
jan 1, 1972
Maximum:
63.591
jan 1, 2013
At the date of observation
Value
Absolute change
Change from previous value
jan 1, 1971
21.076
+21.076
0.0%
jan 1, 1972
21.011
-0.065
-0.31%
jan 1, 1973
21.483
+0.472
2.25%
jan 1, 1974
22.772
+1.289
6.0%
jan 1, 1975
23.238
+0.466
2.05%
jan 1, 1976
24.501
+1.263
5.44%
jan 1, 1977
25.953
+1.452
5.93%
jan 1, 1978
27.815
+1.862
7.17%
jan 1, 1979
29.632
+1.817
6.53%
jan 1, 1980
31.078
+1.446
4.88%
jan 1, 1981
32.221
+1.143
3.68%
jan 1, 1982
32.744
+0.523
1.62%
jan 1, 1983
34.282
+1.538
4.7%
jan 1, 1984
35.475
+1.194
3.48%
jan 1, 1985
36.781
+1.305
3.68%
jan 1, 1986
38.273
+1.492
4.06%
jan 1, 1987
40.115
+1.842
4.81%
jan 1, 1988
41.264
+1.149
2.87%
jan 1, 1989
41.768
+0.504
1.22%
jan 1, 1990
42.446
+0.678
1.62%
jan 1, 1991
44.855
+2.408
5.67%
jan 1, 1992
44.959
+0.105
0.23%
jan 1, 1993
43.947
-1.013
-2.25%
jan 1, 1994
44.513
+0.566
1.29%
jan 1, 1995
46.275
+1.762
3.96%
jan 1, 1996
46.317
+0.042
0.09%
jan 1, 1997
46.378
+0.061
0.13%
jan 1, 1998
47.566
+1.188
2.56%
jan 1, 1999
48.952
+1.386
2.91%
jan 1, 2000
50.377
+1.425
2.91%
jan 1, 2001
51.614
+1.237
2.46%
jan 1, 2002
52.993
+1.379
2.67%
jan 1, 2003
53.979
+0.985
1.86%
jan 1, 2004
55.892
+1.914
3.55%
jan 1, 2005
57.601
+1.708
3.06%
jan 1, 2006
57.693
+0.092
0.16%
jan 1, 2007
57.629
-0.064
-0.11%
jan 1, 2008
56.923
-0.706
-1.23%
jan 1, 2009
57.588
+0.665
1.17%
jan 1, 2010
59.312
+1.724
2.99%
jan 1, 2011
60.475
+1.163
1.96%
jan 1, 2012
62.512
+2.038
3.37%
jan 1, 2013
63.591
+1.079
1.73%
jan 1, 2014
62.172
-1.419
-2.23%
jan 1, 2015
63.015
+0.843
1.36%
Ranking of countries by current statistics by years


Comments: